eISSN: 2379-6367


Research Article Volume 10 Issue 5
Department of Pharmaceutical Chemistry, Faculty of Pharmacy, AIMST University, Malaysia
Correspondence: Naeem Hasan Khan, Department of Pharmaceutical Chemistry, Faculty of Pharmacy, AIMST University, Malaysia
Received: August 17, 2022 | Published: September 29, 2022
Citation: Ching LS, Perveen N, Khan NH. Anti-hyperlipidemic activity screening on induced hyperlipidemia in rats, anti-microbial activity determination and phytochemicals evaluation of Morus Rubra fruits extract. Pharm Pharmacol Int J. 2022;10(5):177-183. DOI: 10.15406/ppij.2022.10.00382
To prepare the ethanolic extract of fresh fruits of Morus Rubra through maceration method and study the antihyperlipidemic effects of the extracts in Triton X-100 induced hyperlipidemia rats. The fresh fruits of Morus Rubra were purchased from local Chinese medicine store. The air-dried fresh fruits of Morus Rubra were extracted with absolute ethanol (99-100%) through maceration method for 8 days. Hyperlipidemia was induced in male Sprague-Dawley rats by 10% Triton X-100 (100mg/kg, i.p) injection. Hyperlipidemia rats were treated with simvastatin (20mg/kg, p.o) or fresh fruits of Morus Rubra extract (100, 200 and 400 mg/kg, p.o) for 7 days. The blood samples were collected before and after treatment of simvastatin and extract to access antihyperlipidemic effect of an ethanolic extract of fresh fruits of Morus Rubra. The mass of the rats also weighted at regular interval which is at day 1, 3 and 7. At the end of the experiment, serum lipid profile was analyzed for all the experimental animals and compared with hyperlipidemic control. The ethanolic extract of fresh fruits of Morus Rubra at 100, 200 and 400 mg/kg has showed significant antihyperlipidemic activity. The experiment rats exhibited a significant change in lipid profile as compare to hyperlipidemia group. The ethanolic extract of the fresh fruits of Morus Rubra showed significant antihyperlipidemic activity against Triton X-100 induced hyperlipidemia rats
Keywords: Morus rubra, triton X-100 induced hyperlipidemia, ethanol, simvastatin
Hyperlipidemia, also known as dyslipidemia and is a medical term for abnormally elevated level of any form of lipids in the blood. The three main types of lipid in human body are phospholipid, triglyceride and cholesterol. Lipids are significant as they assist in essential process such as hormones production, energy storage, regulating and signalling, insulating and protecting, as well as vitamin absorption. However, an excess amount of blood lipids can bring a bad outcome and problems. According to Malaysian Clinical Practice Guidelines (CPGs). Dyslipidemia refers to the following lipid levels in which total cholesterol (TC) level more than 5.2 mmol/L, high-density lipoprotein (HDL) cholesterol less than 1.0 mmol/L in males and less than 1.2 mmol/L in females, triglycerides (TG) more than 1.7 mmol/L. Lastly, low-density- lipoprotein (LDL) cholesterol is depended on the patient’s cardiovascular risk. Cholesterol levels may sometimes be affected by certain medications. For instance, diuretics, birth control pills, corticosteroid and anti-retrovirals used for HIV treatment. Certain health conditions can also contribute to high cholesterol levels, including kidney disease, liver disease, diabetes, and underactive thyroid.1 Hyperlipidemia can be further subdivided into two classification which is primary (familial) or secondary (acquired) hyperlipidemia. Familial hyperlipidemia can be further sub-divided into five types according to Fredrickson classification as shown in Table 1 which is based upon the pattern of lipoproteins on electrophoresis or ultracentrifugation. It was later adopted by the World Health Organization (WHO).
Type |
Total Cholesterol |
LDL Cholesterol |
Plasma Triglyceride |
Lipoprotein abnormality |
Primary causes |
Secondary causes |
I |
Elevated |
Lower/normal |
Elevated |
Excess chylomicrons |
Lipoprotein lipase/apo-lipoprotein II deficiency |
Systemic lupus |
IIa |
Elevated/normal |
Elevated |
Normal |
Excess LDL |
Familial hyper-cholesterolimia |
Hypothyroidism |
IIb |
Elevated |
Elevated |
Elevated |
Excess LDL and VDVL |
Familial combined hyperlipidemia |
Nephrotic syndrome, diabetes, anorexia nervosa |
III |
Elevated |
Lower/normal |
Elevated |
Excess chylomicron remnants/intermediate density lipoproteins |
Familial type III hyper- lipoproteinemia |
Hypothyroidis diabetes, obesity |
IV |
Elevated/normal |
Normal |
Elevated |
Excess VLDL |
Familial combined hyperlipidemia, familial hyper- triglyeridemia |
Diabetes, chronic renal diseases |
V |
Elevated |
Normal |
Elevated |
Excess chylomicrons/VLDL |
familial hyper- triglyeridemia, apo-lipoprotein II deficiency |
Alcohol, diuretics, β- blockers |
Table 1 Fredrickson classification of hyperlipidemias2
Hyperlipidemia is a strong risk factor for cardiovascular disease (CVD). CVD has been the leading cause of mortality in both Malaysian men and women for more than a decade.3,4 CVD includes coronary heart disease (CHD), cerebrovascular disease (strokes) and peripheral arterial disease (PAD). Dyslipidemia remains a significant problem in Malaysia, with the National Health and Morbidity survey in 2015 reporting an estimated 47% of the adult population having hypercholesterolemia. In the main, dyslipidemia is asymptomatic but its associations with serious vascular conditions such as acute myocardial infarction and stroke are well known.5 There are total of six major groups of lipids modifying drugs that involved in management of dyslipidemia. However, beside modern drug, ever since the dawn of earth, human beings are bank on plants for their survival, including their health benefits.
The same trend has been continued even now and approximately 80% of the populations around the globe rely on drugs that are obtained from plant sources. These natural sources were once used for folklore practices, without the knowledge of the active constituent present in them and which was long before the modern medicinal drugs were developed. In traditional Chinese herbal medicine, Morus Rubra (red mulberry) fresh fruits have been used in folk medicine to treat diabetes, hypertension, anemia, and arthritis. Morus rubra is a deciduous tree species from the Moraceae family.
It is originated from the eastern part of the United States America and is widely distributed in the moist soils of mesic hardwood forests, floodplains, and other moist sites from south Florida, west to Texas, north to Minnesota and the extreme southern portion of Ontario, Canada, and east to the Mid-Atlantic States. Morus rubra is a deciduous tree that can grow up to 21 m (70 feet). It flower’s from April to May and the seeds are harvested from June to August. The species is dioecious (individual flowers are either male or female, but only one sex is to be found on any one plant so both male and female plants must be grown if seed is required). The minute flowers are borne in tight catkin clusters. Each fruit develops from an entire flower cluster and is formally known as a multiple. Red mulberry bears on the average 50 multiple fruits per branch and yields about 8.6 fruits/g or 8,600 fruits/kg. In addition, the plant is not self-fertile.6 Fresh fruits, tree and leaves are shown in Figures 1-3 accordingly.
Recently, the production and consumption of Morus Rubra has increased rapidly because of good taste, nutritional value, and biological activities. Morus Rubra fresh fruits can be used as a warming agent, a remedy for dysentery, and a laxative, odontalgic, anthelmintic, expectorant, hypoglycemic, and emetic.7 Anthocyanins are the most important constituent of Morus Rubra, which are a group of naturally occurring phenolic compounds that are responsible for the color attribute and biological activities such as antioxidant, antimicrobial, and neuroprotective, anti-inflammatory properties.8 In recent studies, Morus Rubra also known to be have antihyperlipidemic effect.9 According to its beneficial properties, Morus Rubra can consider to be developed into nutraceutical which defined as any substance that is a food or part of a food and provides medical or health benefits, including the prevention and treatment of disease. Table 2 and Table 3 showed the taxonomical classification and vernacular names of Morus rubra respectively. Table 4 & 5 shows the organoleptic characteristics and medical uses, respectively.
Taxonomy |
Classification |
Kingdom |
Plantae |
Subkingdom |
Tracheobionta |
Division |
Magnoliophyta |
Class |
Magnoliopsida |
Subclass |
Hamamelididae |
Order |
Urticales |
Family |
Moraceae |
Genus |
Morus L. |
Species |
Morus rubra L. |
Language |
Vernacular names |
Chinese |
Hong Sang, Song She shue |
English |
Red mulberry, Red-Fruited Mulberry, Black-Fruited Mulberry, American Mulberry |
Malay |
Mulberi Merah |
Tamil |
Mucukkattaip palam |
French |
Mûrier Rouge, Mûrier Sauvage |
German |
Roter Maulbeerbaum Rote Maulbeere |
Greek |
Kokkini Muria |
Italian |
Gelso Rosso, Moro Rosso |
Japanese |
Aka Mi Guwa, Ke Guwa |
Korean |
Ppong-na-mu-sok |
Russian |
Shelkovitsa Krasnaia |
Spanish |
Mora De Árbol, Moral Rojo, Mora Roja |
Swedish |
Mullbär |
Table 3 Vernacular names of Morus Rubra12
Organoleptic Characteristic |
Description |
Appearance |
Soft, aggregate of druplets |
Colour |
Reddishly maturing to dark purple or black in colour |
Taste |
Sweet flavor with some sourness |
Odour |
Aromatic |
Size |
2.5–4.0cm |
Table 4 Organoleptic characteristic of Morus Rubra12
Bioactive constituents |
Medical properties |
Alkaloid |
Anti-dopaminergic, Antimicrobial, Antidiabetic |
Anthocyanin |
Antioxidant, Anti-inflammatory, Antibacterial |
Arylbenzofurans |
Antifungal, Antibacterial |
Chlorogenic Acid |
Anti-mutagenic, Anti-carcinogenic, Anti-diabetes, Antibacterial |
Fatty acid |
Anti-inflammatory |
Flavonoid |
Anti-mutagenic, Inhibition of melanin biosynthesis, Antimicrobial, Antidiabetic |
Glycosides |
Antioxidant, Hypocholesterolemia, Antimicrobial, Antidiabetic |
Rutin |
Antidiabetic, Antioxidant, Anti-inflammatory, Antimicrobial |
Steroids |
Antidiabetic, Immunomodulatory, Antidiabetic |
Stilbenes |
Antiviral, Anti-proliferation |
Tannins |
Anticancer, Nephroprotective, Antimicrobial |
Terpenoids |
Anthelmintic, Anxiolytic, Antimicrobial, Antidiabetic |
Table 5 Morus Rubra with pharmacological actions12
Collection and preparation of plant material
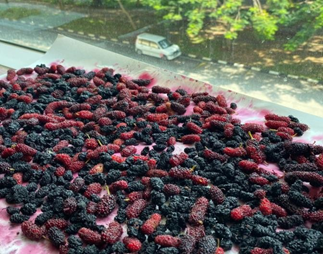
300g of fresh fruits of Morus Rubra (mulberry) were weighted and spread to allow air drying under room temperature for the duration of 2 days (Figure 4,5).

Figure 5 The fruits were spread on the cardboard and allowed air drying under room temperature under shade.
Maceration extraction method
Maceration Process of fresh fruits of Morus Rubra was carried out after 2 days of air dried.
Evaporation and concentration of extract using rotary evaporator
(a) = Weight of porcelain dish containing Morus Rubra fruit extraction (136.17g)
(b) = Weight of an empty porcelain dish (85g)
(c) = Weight of Morus Rubra fruit extraction (51.17g) (Figure 6).
Phytochemical analysis
The presence of 25 different phytochemical groups were checked using the ethanolic extract as shown in Table 6.
S. no |
Phytochemicals |
Results (ethanolic maceration extract) |
1 |
Carbohydrates |
+ |
2 |
Monosaccharides |
+ |
3 |
Polysaccharide |
- |
4 |
Reducing Sugar |
+ |
5 |
Pentose Sugar |
- |
6 |
Hexose Sugar |
+ |
7 |
Galactose |
+ |
8 |
Protein |
+ |
9 |
Amino Acid |
+ |
10 |
Free Fatty Acid |
- |
11 |
Saturated Fatty Acid |
+ |
12 |
Neutral Lipid |
+ |
13 |
Volatile Oil |
- |
14 |
Steroid |
- |
15 |
Terpenoid |
+ |
16 |
Glycoside |
+ |
17 |
Anthraquinones Glycoside |
+ |
18 |
Cardiac Glycoside |
- |
19 |
Cyanogenic Glycoside |
- |
20 |
Coumarin Glycoside |
+ |
21 |
Saponin |
- |
22 |
Alkaloid |
+ |
23 |
Flavonoid |
+ |
24 |
Phenol |
+ |
25 |
Tannin |
+ |
Table 6 Phytochemical groups identified
(+) sign indicates the presence of phytochemical, (-) sign indicates the absence of phytochemicals
Antimicrobial analysis
Preparation and assay of nutrient broths for MIC, MBC, serial dilution procedure for MIC and preparation of nutrient agar plates for MBC test were followed as described already elsewhere by our group research.
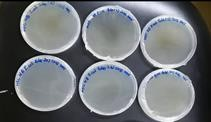
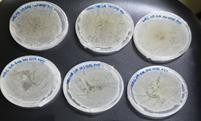
M. rubra fruit did not show antibacterial activity against E. coli and Streptococcus aureus. It is considered not susceptible to gram negative bacterial. The results are laid down in Figures 6, 7 respectively where no zone of inhibition was observed. Figure 7 is of MBC on E. coli at 500, 250 and 125 mg/ml concentration. Figure 8 shows the results of MBC on S. aureus at 500, 250 and 125 mg/ml concentration. Figure 9 and 10 shows the results of E. coli and S. aureus where there is no growth.

Figure 9 MBC result of triplicate sets of E. coli and a positive control. There is no observation of bacterial growth.

Figure 10 MBC result of triplicate sets of S. aureus and a positive control. There is no observation of bacterial growth.
Animals
36 healthy, adult male Sprague Dawley rats (180±20g) were obtained from central animal house, AIMST University, Malaysia. Animal will house in six separates large, spacious polyacrylic cages at ambient room temperature with 12 hours light/12 hours dark cycle. Animal was allowed to acclimatize for a period of 1 week before utilized in the study. The rats were fed with normal rodent pellets and water ad libitum. The care of animals was carried out according to the guidelines of the AUAEC. The completed animal ethics clearance application form for this study was submitted and approved (AUAEC/FOP/2022/09). Figure 11 gives the information about 36 healthy, adult male Sprague Dawley rats in AIMST central animal house. Figure 12 is showing the feeding of diabetic rat with plant extract by oral gavage.
Induction of hyperlipidemia
Six groups of adult rats (n=6) were employed in this study. Hyperlipidemia was induced in overnight-fasted rats by intra-peritoneal injection of Triton X-100 (100mg/kg) for 3 days.13 The mode of administration is by oral gavage. The administration for Group III Hyperlipidemia rats with simvastatin (20mg/kg) and Group IV, Hyperlipidemia rats with Morus Rubra fresh fruits extraction (100mg/kg), Group V- Hyperlipidemia rats with Morus Rubra fresh fruits extraction (200mg/kg) while Group VI - Hyperlipidemia rats with Morus Rubra fresh fruits. It is already mentioned in experimental design below.
Experiment design
Adult, healthy male Sprague Dawley rats (180±20 g) were used for the experiment. The rats were divided into six different groups of six animals as follows:
Group I – Normal control rats
Group II – Hyperlipidemic control
Group III – Hyperlipidemia rats with simvastatin (20mg/kg)
Group IV – Hyperlipidemia rats with Morus Rubra fresh fruits extraction (100mg/kg)
Group V – Hyperlipidemia rats with Morus Rubra fresh fruits extraction (200mg/kg)
Group VI – Hyperlipidemia rats with Morus Rubra fresh fruits extraction (400mg/kg)
After 7 days of study, the blood sample of rats was collected and measured the lipid profile by using refloton analyzer with strips.
Body weight analysis
The body weight of each rat in each group was recorded on day 1, 3 and 7. The percentage change in body weight was calculated.
Collection of plasma
A blood sample (0.5 ml) was collected from each experimental animal on the day preceding the commencement of the study and the last day of the study. The samples were drawn from the retro-orbital sinus under mild ether anaesthesia.14 The blood samples were collected in Eppendorf tubes and centrifuged at 10000 RPM for 6 min. The plasma obtained was maintained at 80°C until analysis.
Biochemical estimation
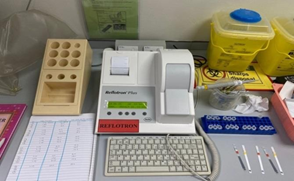
The plasma was used to estimate the plasma lipid profile. The TC, TG and HDL levels were measured using a Reflotron Biochemical Analyzer (Reflotron Plus System, Hoffmann-La Roche, USA) and lipid profile analytical strips. The LDL, VLDL ratio and AD were calculated mathematically. Estimation of plasma lipid profile using a Reflotron biochemical analyzer and lipid profile analytical strip is shown in Figure 13.

Figure 13 Estimation of plasma lipid profile using a Reflotron biochemical analyzer and lipid profile analytical strip.
Statistical analysis
All the values are represented as the mean S.E.M. Statistical differences among the groups were determined using One-way repeated measures ANOVA, followed by the Turkey post hoc test. P<0.05 was considered to be significant.
Antimicrobial activity screening (MIC/MBC) of maceration extract
Results of MIC and MBC of Ethanolic Extract (Table 7).
Maceration Extract Concentration (mg/ml) |
The Growth of Bacteria |
|
E. coli |
S. aureus |
|
500 |
- |
- |
250 |
- |
- |
125 |
- |
- |
62.5 |
- |
- |
Table 7 (-) sign indicates bacterial growth is not observed
Effect of ethanolic extract of fresh fruits of Morus Rubra on body weight of Triton X-100 induced hyperlipidemia rats is shown in Table 8.
|
Day 1 |
Day 3 |
Day 7 |
Group I |
162.72 ± 1.93 |
163.18 ± 1.97 |
162.85 ± 1.46 |
Group II |
162.28 ± 2.38 |
161.37 ± 1.70 |
160.45 ± 1.84 |
Group III |
161.65 ± 1.82 |
162.02 ± 1.85 |
161.67 ± 1.83 |
Group IV |
162.03 ± 1.90 |
162.05 ± 1.84 |
162.07 ± 2.01 |
Group V |
161.40 ± 1.89 |
161.33 ± 1.76 |
161.37 ± 1.78 |
Group VI |
162.10 ± 1.93 |
162.50 ± 1.76 |
162.73 ± 1.69 |
Table 8 Effect of ethanolic extract of fresh fruits of Morus Rubra on body weight of rats
All the values are mean ± SEM (n =6).
Table 9 showed the result on lipid profile of Triton X-100 induced hyperlipidemia rats after triton administration. There was a significant elevation in total cholesterol, triglyceride, LDL, VLDL and atherogenic dyslipidemia in triton-induced hyperlipidemic rats (Group II, III, IV, V and VI) when compared with normal control (Group I). At this time, an increased level of HDL cholesterol was also observed. Triton showed a significant decrease (P<0.001) in HDL level when compared to the control group (Group I).
|
Total Cholesterol (mg/dl) |
Triglyceride (mg/dL) |
HDL (mg/dL) |
LDL (mg/dL) |
VLDL |
Atherogenic Dyslipidemia (AD) |
Group I |
112.14 ± 4.12 |
87.09 ± 8.06 |
37.33 ± 1.88 |
57.39 ± 4.69 |
11.48 ± 0.94 |
0.36 ± 0.05 |
Group II |
255.22 ± 10.71*** |
162.00 ± 8.44*** |
19.67 ± 1.20*** |
203.16 ± 10.61*** |
40.63 ± 2.12*** |
0.92 ± 0.03*** |
Group III |
242.33 ± 9.35*** |
154.17 ± 9.30** |
22.28 ± 0.86*** |
189.22 ± 10.01*** |
37.84 ± 2.00*** |
0.84 ± 0.04*** |
Group IV |
258.44 ± 11.70*** |
156.00 ± 13.36*** |
20.78 ± 1.50*** |
206.46 ± 13.07*** |
41.29 ± 2.61*** |
0.87 ± 0.06*** |
Group V |
256.51 ± 10.69*** |
165.67 ± 14.39*** |
21.28 ± 0.99*** |
202.09 ± 9.13*** |
40.42 ± 1.83*** |
0.89 ± 0.05*** |
Group VI |
252.00 ± 8.73*** |
141.50 ± 6.27* |
21.62 ± 1.53*** |
202.08 ± 9.18*** |
40.42 ± 1.84*** |
0.82 ± 0.03*** |
Table 9 Lipid profile of rats after triton administration
All the values are mean ± SEM (n=6). *P<0.05, **PM<0.01 and ***P<0.001 compare with that of control group (One-way ANOVA followed by Tukey’s post-hoc test).
Table 10 showed the result with ethanolic extract of fresh fruits of Morus Rubra on lipid profile of Triton X-100 induced hyperlipidemia rats at the end of the study. Standard control (Group II) showed significant elevated in TC, TG, LDL, VLDL and AD when compared to normal group (Group I). Group III treated with standard antihyperlipidemic agent simvastatin 10 mg/kg body weight showed significant decreased in TC, TG, LDL, VLDL and AD when compared to hyperlipidemia group (Group II). Group that treated with ethanolic extract of fresh fruits of Morus Rubra (Group IV, V and VI) showed significant serum lipid-lowering effects in Triton- induced hyperlipidemia rats which brought down TC, TG, LDL, VLDL and AD when compared to the hyperlipidemia group (Group II).
|
Total Cholesterol (mg/dl) |
Triglyceride (mg/dL) |
HDL (mg/dL) |
LDL (mg/dL) |
VLDL |
Atherogenic Dyslipidemia (AD) |
Group I |
111.69 ± 5.35 |
93.00 ± 6.76 |
36.40 ± 2.37 |
56.69 ± 4.94 |
11.34 ± 0.99 |
0.41 ± 0.06 |
Group II |
239.11 ± 16.66*** |
173.00 ± 11.02*** |
22.60 ± 3.34 |
181.91 ± 15.92*** |
36.38 ± 3.18*** |
0.90 ± 0.07*** |
Group III |
133.41 ± 10.12### |
120.67 ± 9.80## |
31.58 ± 4.47 |
77.69 ± 9.31### |
15.54 ± 1.86### |
0.60 ± 0.06 |
Group IV |
164.15 ± 24.10# |
136.17 ± 11.25* |
27.18 ± 3.04 |
109.74 ± 24.84# |
21.95 ± 4.97# |
0.71 ± 0.08** |
Group V |
142.37 ± 14.31### |
91.67 ± 5.29### |
29.05 ± 4.93 |
94.99 ± 13.80## |
19.00 ± 2.76## |
0.53 ± 0.10* |
Group VI |
138.57 ± 8.90### |
94.17 ± 7.71### |
32.90 ± 4.12 |
86.83 ± 12.66## |
17.37 ± 2.53## |
0.47 ± 0.04** |
Table 10 Effect of ethanolic extract of fresh fruits of Morus Rubra on lipid profile of rats at the end of the study
All the values are mean ± SEM (n =6). *P<0.05, **PM<0.01 and ***P<0.001 compare with that of control group; #P<0.05, ##P<0.01 and ###P<0.001 compare with that of hyperlipidaemia group (group II) (One-way ANOVA followed by Tukey’s post-hoc test).
The side effects were not concluded because due to availability of special laboratory.
The extraction method used in this study is maceration extraction and ethanol was chosen as a solvent. The antihyperlipidemic activity of ethanolic extract fresh fruits of Morus Rubra was study on Triton X-100 induced hyperlipidemia rats. Result of this study revealed that the ethanolic extract of fresh fruits of Morus Rubra improved the serum lipid profile in rats by decreasing serum TC, TG, LDL, VDLD, AD and increasing serum HDL-C, thus improving the atherogenic index. This finding provides some biochemical basis for the use of fresh fruits of Morus Rubra as antihyperlipidemic agent having preventive and curative effect against hyperlipidemia. Further studies, on different taxonomy of Morus Species, isolation, purification and bioactive phytochemical constituent analysis of this plant are required to reveal more healthy benefits for the public and therapeutic uses in the medical field.
Approval from the AIMST University Human and Animals Ethics Committee (AUHAEC/FOP) was obtained prior to the study. This research was conducted in accordance with the recommendations of AUHAEC Guidelines.
The authors are highly thankful to the Faculty of Pharmacy, AIMST University, Bedong, Kedah D.A., Malaysia for funding and providing facilities to carry out this research project.
Thanks to science officers Miss Amalina and Miss Jaya.
Authors declare that there is no conflict of interests.

©2022 Ching, et al. This is an open access article distributed under the terms of the, which permits unrestricted use, distribution, and build upon your work non-commercially.