MOJ
eISSN: 2573-2919


Research Article Volume 10 Issue 4
 Kardelen Arici,1 Serap Göncü,1 Atalay Ergül,2 Ahmet Bayram1
1Animal Science Department, Agriculture Faculty, Çukurova University, Turkey
2Eastern Mediterranean Agricultural Research Institute, Turkey
Correspondence: Atalay Ergül, Eastern Mediterranean Agricultural Research Institute, Turkey
Received: August 28, 2025 | Published: September 8, 2025
Citation: Bingöl S, Arıcı K, Göncü S, et al. Magnetic field measurement at different locations of a livestock farm. MOJ Eco Environ Sci. 2025;10(4):161-163. DOI: 10.15406/mojes.2025.10.00361
This study aimed to measure environmental magnetic field intensity at different locations and to evaluate its potential effects on animal health. Magnetic field measurements were conducted at 25 locations, each with three repetitions, and recorded in microtesla (μT). Descriptive statistics were calculated, and one-way analysis of variance (ANOVA) followed by Duncan’s Multiple Range Test was applied to determine differences between locations. Results indicated that magnetic field intensity at most locations ranged between 0.2 and 20 μT, representing safe levels. However, a measurement of 210 μT at location 2 was notably higher than the others and considered an outlier. Duncan’s test confirmed that most locations were statistically similar, with only location 2 forming a distinct group. These findings suggest that magnetic field exposure in animal habitats is generally low, although certain specific points may require monitoring. The study highlights the importance of environmental magnetic field assessment for animal health and welfare.
Keywords: magnetic field, microtesla, animal health
Recently, exposure to electromagnetic fields has become an increasing concern in both environmental and public health contexts. Power lines, electronic devices, and industrial equipment generate magnetic fields of varying intensity, and their potential effects on human health have been widely debated.1 Measuring magnetic field intensity is particularly important for assessing exposure in residential areas, workplaces, and public environments. Environmental magnetic fields can differ greatly depending on frequency, source intensity, and location characteristics. Therefore, measurements taken at different sites are critical for determining exposure levels and for evaluating the potential risks of elevated values.2
In the literature, low-frequency magnetic fields (50–60 Hz) are generally reported within the range of 0–20 µT, with higher values observed only in certain industrial areas or locations close to power transmission lines (Hefeneider et al., 2001). Measurement of magnetic field intensity is also regarded as a critical parameter for evaluating animal health and behavior. Low- and high-frequency magnetic fields generated around power lines, high-voltage equipment, or industrial facilities can influence the physiological and behavioral responses of animals. In particular, for production animals such as cattle, sheep, goats, and poultry, exposure to electromagnetic fields has been reported to affect feed intake, milk yield, reproductive performance, stress levels, and behavioral patterns (Hefeneider et al., 2001; Algers & Hultgren, 1987).1
Investigating the impacts of magnetic fields on animals is important not only for production efficiency but also for ensuring animal welfare and preventing health risks (Reighleigh et al., 1986). For this reason, environmental magnetic field measurements are conducted in livestock farmss and grazing areas to determine the long-term exposure of animals. In cases where high magnetic field intensities are detected, management measures such as reorganizing production facilities and housing animals in safe zones can be implemented.3,4
This study aimed to measure magnetic field intensities at different locations, statistically analyze the data, and evaluate the impact of extreme outliers on the overall distribution. Furthermore, the findings are intended to contribute to the interpretation of environmental magnetic field safety limits in relation to animal health, welfare, and public health.
This study was carried out in a livestock farms, specifically within the milking parlor and several other sections, to determine magnetic field intensity in different operational areas. Measurements were conducted at 25 locations selected to represent different parts of the facility. At each location, three consecutive day, measurements were taken with three replications to increase reliability. The measurement points included the interior of the milking parlor, areas containing electrical panels and cables, different locations of dairy barn, and outdoor areas, thus covering a wide range of farm environments. Magnetic field measurements were performed using a Smart Sensor AS1392 EMF meter (Figure 1).
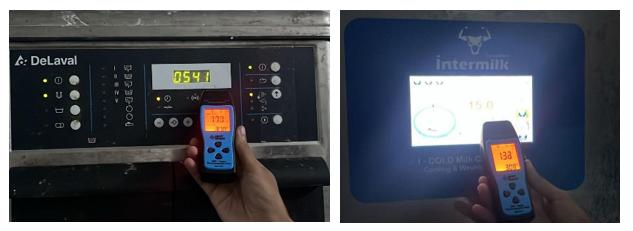
Figure 1 Device used for magnetic field measurements.
This instrument is suitable for measuring low-frequency electromagnetic fields, with a measurement range of 0–200 µT, a resolution of 0.1 µT, and an accuracy of ±5%. It operates within the 30–300 Hz frequency range and provides reliable data with an approximate sampling interval of 0.5 seconds. -Calibration was performed according to the manufacturer’s recommended procedures and checked regularly during the study. At each measurement locations, readings were taken at ground level (representing the animal exposure zone) as well as at approximately human height (representing worker exposure). Thus, both animal and personnel exposure were evaluated. After each replication, values were recorded in microtesla (µT), and mean, minimum, and maximum values were calculated for each location.
For statistical analysis, descriptive statistics (mean, standard deviation, minimum, maximum) were first calculated. Then, one-way analysis of variance (ANOVA) was applied to determine differences among locations. Duncan’s Multiple Range Test was used to identify which locations contributed to the observed differences. Outliers were also evaluated in terms of their influence on statistical outcomes. All analyses were conducted using SPSS 28.0 software, with statistical significance set at p < 0.05.
The mean, standard deviation, standard error, minimum, and maximum values of magnetic field intensities (measured in microtesla, µT) recorded at different locations of the livestock farms are presented in Table 1. The results of magnetic field measurements conducted across the 25 locations are summarized in this table. The overall mean magnetic field intensity was found to be 9.00 µT, with a total standard deviation of 24.33 µT. This high standard deviation was mainly due to the exceptionally high maximum value of 210 µT measured at location 2, clearly indicating that this point was an outlier compared to the other measurement sites.
|
Locations |
Mean |
Std. Dev. |
Std. Error |
Min. |
Max. |
|
1,00 |
83,667 |
1,008,481 |
582,247 |
2,0 |
20,00 |
|
2,00 |
839,000 |
10,920,994 |
6,305,239 |
19,90 |
210,00 |
|
3,00 |
32,000 |
,10000 |
,05774 |
3,10 |
3,30 |
|
4,00 |
,4000 |
,20000 |
,11547 |
0,20 |
,60 |
|
5,00 |
161,067 |
170,004 |
,98152 |
14,40 |
17,80 |
|
6,00 |
13,133 |
,48014 |
,27721 |
0,90 |
1,84 |
|
7,00 |
35,333 |
,47258 |
,27285 |
3,00 |
3,90 |
|
8,00 |
120,400 |
,95016 |
,54857 |
11,02 |
12,90 |
|
9,00 |
92,033 |
,25697 |
,14836 |
9,05 |
9,50 |
|
10,00 |
14,867 |
,41585 |
,24009 |
1,18 |
1,96 |
|
11,00 |
193,667 |
,35119 |
,20276 |
19,00 |
19,70 |
|
12,00 |
109,000 |
,79373 |
,45826 |
10,00 |
11,50 |
|
13,00 |
35,200 |
,30199 |
,17436 |
3,20 |
3,80 |
|
14,00 |
16,033 |
,36199 |
,20899 |
1,20 |
1,90 |
|
15,00 |
101,733 |
109,551 |
,63249 |
9,02 |
11,20 |
|
16,00 |
57,867 |
,11015 |
,06360 |
5,66 |
5,86 |
|
17,00 |
84,167 |
,59197 |
,34178 |
8,06 |
9,10 |
|
18,00 |
10,067 |
,39247 |
,22659 |
0,57 |
1,33 |
|
19,00 |
,2667 |
,11547 |
,06667 |
0,20 |
,40 |
|
20,00 |
14,167 |
,08505 |
,04910 |
1,33 |
1,50 |
|
21,00 |
,3967 |
,01528 |
,00882 |
0,38 |
,41 |
|
22,00 |
,2033 |
,01155 |
,00667 |
0,19 |
,21 |
|
23,00 |
91,233 |
134,909 |
,77890 |
7,61 |
10,20 |
|
24,00 |
,4000 |
,00000 |
,00000 |
0,40 |
,40 |
|
25,00 |
129,333 |
312,143 |
180,216 |
10,70 |
16,50 |
|
Average |
90,025 |
2,432,978 |
280,936 |
0,19 |
210,00 |
Table 1 Statistical summary of magnetic field intensities (measured in microtesla, µT) at different locations of the livestock farms
At the remaining locations, magnetic field intensities generally ranged between 0.2–20 µT, corresponding to low to moderate exposure levels. Low values (e.g., locations 4, 18, 19, 20, 21, 22, and 24) indicated minimal environmental magnetic field exposure, whereas medium-level measurements (e.g., locations 1, 5, 8, 9, 11, 12, 15, 17, 23, and 25) reflected natural background fields or the presence of low-power electromagnetic sources. The extremely high outlier value most likely represented measurements taken in close proximity to power lines or electrical devices.
Overall, the data suggest that environmental magnetic field exposure at most farm locations remains within safe limits. However, specific points where elevated intensities were detected require careful consideration and further monitoring to ensure both livestock welfare and safe production environments (Figure 2).
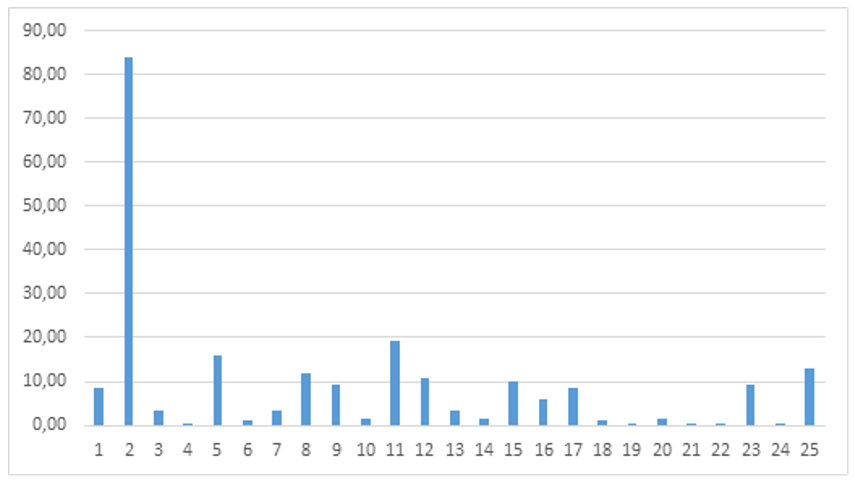
Figure 2 Variation of magnetic field values in the livestock farms.
The results of the one-way analysis of variance (ANOVA) comparing magnetic field values measured at different locations indicated that the between-groups sum of squares was 19,708.79, the within-groups sum of squares was 24,094.65, and the total sum of squares was 43,803.44. The mean square between groups was 821.20, the mean square within groups was 481.89, and the F value was 1.704. The significance level (p) was calculated as 0.056. These results show that there were no statistically significant differences in magnetic field values among the different locations (p > 0.05). However, since the p-value was close to the 0.05 threshold, this suggests a possible trend or small differences among locations. This tendency is likely attributable to the extremely high outlier observed at location 2, which may have influenced the overall means. As noted in the literature, the presence of outliers can affect ANOVA results, making it more difficult to detect differences among groups.5,6 Therefore, in data evaluation, the effect of outliers should be carefully considered, and analyses may need to be repeated with the outlier removed.
Some resarchers, emphasized that outliers in environmental magnetic field measurements can significantly affect the mean and complicate the interpretation of data distribution.4,7 Examination of the table indicates that most locations concentrated within the range of 0.2–20 µT, which is considered acceptable for human health.3 In particular, low values (locations 4, 18, 19, 20, 21, 22, 24) represented minimal environmental exposure, while moderate values (locations 1, 5, 8, 9, 11, 12, 15, 17, 23, 25) reflected the influence of low-power electromagnetic sources. The high outlier values, on the other hand, signaled the presence of local electromagnetic sources such as power lines or industrial electrical equipment, which must be considered during both measurement protocols and data analysis. In this context, careful handling of outliers in environmental magnetic field evaluations is crucial to ensure the accurate interpretation of safety limits, particularly in relation to livestock production environments and animal welfare.8–14
In this study, magnetic field intensity values measured at different locations were examined and their potential effects on animal health were evaluated. The findings demonstrate that livestock are generally exposed to low levels of magnetic fields in their housing environments, and the risk of adverse effects on productivity and welfare is minimal. The following recommendations are proposed:
None.
None.
There are no conflicts to declare.

©2025 Bingöl, et al. This is an open access article distributed under the terms of the, which permits unrestricted use, distribution, and build upon your work non-commercially.
