MOJ
eISSN: 2573-2919


Research Article Volume 10 Issue 5
 Christopher Gómez Monje,2 Sebastian Rivera Jorge1
1Chemical Engineering Department, Faculty of Engineering, Universidad de América, Bogotá, Colombia
2Chemical Engineering Department, Instituto Tecnológico de Morelia, México
Correspondence: Juan Sandoval-Herrera, Chemical Engineering Department, Faculty of Engineering, Universidad de América, Bogotá, Colombia
Received: August 26, 2025 | Published: September 15, 2025
Citation: Sandoval-Herrera J, Monje CG, Jorge SR. Evaluation of photoperiod and light intensity to produce carotenoids and mycosporines from Chlorella vulgaris. MOJ Eco Environ Sci. 2025;10(4):172-175.. DOI: 10.15406/mojes.2025.10.00363
This study investigated the influence of light quality (full-spectrum white vs. monochromatic red) and photoperiod (12:12 h and 16:8 h light/dark cycles) on the growth and accumulation of photoactive metabolites in Chlorella vulgaris. These metabolites are fundamental for producing ecofriendly sun protection creams and other skin products with UV protection. Cultures were grown in Bold Basal Medium under controlled conditions and analyzed using UV-Vis spectrophotometry to estimate the relative content of carotenoids and mycosporine-like amino acids. Growths with white light LED and a 16:8 h photoperiod promoted higher optical density and biomass accumulation, whereas red light induced a photoprotective response associated with greater accumulation of MAAs and carotenoids. The metabolite concentration results under red light: 153.5 ± 3.90 mg of carotenoids per gram of dry matter and 137.92 ± 6.50 mg of MAAs per gram of dry matter are higher than those found in recent literatures. These findings contribute to the design of optimized cultivation strategies for the targeted production of bioactive compounds with applications in photoprotection, cosmetics, and environmental biotechnology.
Keywords: mycosporine-like amino acids, light type, sun photoprotection, secondary metabolites
MAAs, mycosporine-like amino acids; DW, dry weight; ε, molar extinction coefficient of the average carotenoid in acetone; δ, light path length in the quartz cell;, chlorophyll-a absorbance; , maximum absorbance; , MAAs absorbance; TC, total carotenoids; M, molar mass of acetone
Chlorella vulgaris is a unicellular green microalga that has gained significant prominence in biotechnology due to its high growth rate, metabolic versatility, and the wide range of value-added compounds it can synthesize. In photobioreactors designed for water purification, the species can remove up to 97% of nitrates and over 90% of the chemical oxygen demand while generating usable biomass.1 That capacity exceeds the potential of other technologies, such as adsorption through biochar to remove water pollutants2 Furthermore, Chlorella vulgaris fixes CO₂ at rates exceeding 1 g L⁻¹ day⁻¹, contributing to carbon capture and climate change mitigation schemes.3
Beyond environmental applications, C. vulgaris suspensions or extracts have been used as agricultural biostimulants, increasing the yield of various crops and reducing the dependence on synthetic fertilizers.4 However, its industrial interest is increasingly focused on secondary metabolites, such as fat-soluble carotenoids (e.g., lutein, β-carotene), which are pigments with antioxidant and natural coloring properties in high demand in the food, nutraceutical, and cosmetic industries;5 and mycosporine-like amino acids (hereinafter: MAAs), which are water-soluble, low-molecular-weight compounds with UV absorption maxima (~310 nm) that act as natural photoprotectants. Over 180 patents between 2014-2024 describe their inclusion in environmentally friendly sunscreens that do not affect aquatic ecosystems.6
In freshwater ecosystems, the symbiosis between planktonic ciliates and Chlorella demonstrates the natural accumulation of MAAs, underscoring their ecological and biotechnological relevance.7 The spectral quality of light decisively conditions the photosynthetic rate and the allocation of carbon between growth and metabolite synthesis. Switching from full-spectrum white illumination to monochromatic LEDs modifies the proportion of proteins and pigments in C. vulgaris.8,9 Red/blue combinations optimize carotenoid yield per unit of energy,10 while high-intensity blue light (~200 µmol m⁻² s⁻¹) only stimulates growth and lipid accumulation if controlled to prevent photoinhibition.11 A recent meta-analysis confirms that wavelength and photoperiod act synergistically in the biosynthesis of carotenoids and lipids in chlorophytes.12
Considering the variability among studies, this work systematically analyzes the interaction of light type × photoperiod (white vs. red; 12:12 h vs. 16:8 h light/dark) on the biomass growth and accumulation of carotenoids and MAAs in C. vulgaris. The results aim to guide the design of cultures targeted for the sustainable production of photoprotective compounds with applications in cosmetics, nutraceuticals, and environmental biotechnology that contribute to reducing the dependence on toxic and environmentally harsh substances currently in use.
Organism and culture medium
c.vulgaris (an axenic strain from an in-house collection) was used. The inoculum was propagated in sterile Bold's Basal Medium (BBM) prepared according to the original formulation by Bischoff & Bold.13 The pH was adjusted to 6.8–7.0 with 0.1 M HCl. The cultures (200 mL) were housed in 250 mL Erlenmeyer flasks, incubated at 25 ± 2 °C and 120 rpm on an orbital shaker to ensure homogeneity and adequate CO₂ transfer.
Lighting conditions
The cultures were subjected to two light conditions: (a) White light: Provided by full-spectrum, daylight-type LED lamps. Its average intensity was approximately 200 µmol photons m⁻² s⁻¹ as determined by a digital lux meter Bside ® with 4% average accuracy. (b) Red light: Emitted by monochromatic red LED panels (central λ 630-670 nm, light intensity approximately150 µmol photons m⁻² s⁻¹). Both treatments were operated under 12:12 h (12 h light, 12 h dark) and a 16:8 h photoperiod, using automatic timers.14
Experimental design and replication
A completely randomized design was applied with three independent replicates per treatment. The flasks were inoculated to an OD₆₈₀ ≈ 0.10 to ensure homogeneous initial exponential phases and were incubated for 10 days, varying the light intensity and photoperiod as indicated in Table 1.
|
Number of treatment |
Light type |
Photoperiod (Light hours: dark hours) |
|
1 |
White |
16:08 |
|
2 |
White |
12:12 |
|
3 |
Red |
16:08 |
Table 1 Experimental trials
UV-Vis absorbance measurement
At the end of the experiment, samples were taken from each culture. The samples were homogenized and, if necessary, diluted to maintain absorbances ≤ 1.0 AU. Spectrophotometric measurements (300-720 nm) were performed with 1 cm path length quartz cuvettes, using fresh BBM as a blank, on a Genesys 20® Thermo Scientific instrument.15 The spectral resolution was 5 nm, and special attention was paid to the peaks at 310 nm (MAAs), 430 nm, and 680 nm (chlorophyll-a).
Determination of dry biomass and photoactive metabolites
In addition to determining the dry biomass weight, which was evaluated using Equation 1 after separating the biomass by centrifuge and subsequent drying at 60 °C,16 carotenoids and MAAs were extracted using acetone as a solvent and quantified by spectrophotometric method, according to Sandoval et al.,17 using the equations (2) and (3) shown below.
(1)
(2)
(3)
is the absorbance at 430 nm; M is the molecular weight of the average carotenoid (537 g mol⁻¹); ε is the molar extinction coefficient of the average carotenoid in acetone (140663 L mol⁻¹ cm⁻¹); and d is the light path length in the quartz cell (0.5 cm). In equation (3), refers to the area under the absorbance curve between the wavelengths of 319 and 350 nm; and corresponds to the area under the 630 to 680 nm range for chlorophyll-a.18
Data and statistical analysis
Means and standard deviations of the absorbances were calculated for each wavelength of interest. The average absorbances at 310 nm (MAAs) and 480 nm (carotenoids) were specifically compared between treatments. For the comparison, a one-way ANOVA (white light vs. red light) was applied, considering p < 0.05 as significant. Assumptions of normality and homogeneity of variances were verified; if necessary, a logarithmic transformation was performed. No additional post-hoc test was applied as only two groups were compared. The spectra and bar graphs were generated in OriginPro® or Excel®, including standard error bars.
Biomass production
Table 2 presents the dry biomass weight results for the three treatments, with their standard deviation, obtained after a 10-day process.
|
Trials |
Average DW (g L-1) |
Standard deviation |
|
1 |
32.45 |
0.2 |
|
2 |
30.52 |
0.4 |
|
3 |
12.03 |
0.5 |
Table 2 Dry weight (DW) of the microalgal biomass obtained by centrifugations and drying
White light led to greater microalgal biomass accumulation under the 16:8 photoperiod, although the standard deviation for both that treatment and treatment 2 (12:12 photoperiod) does not allow for a significant difference to be seen between these photoperiods. Meanwhile, the cultures under red light, despite being conducted with the most successful photoperiod from the white light trials (16:8), did not grow in density as much as expected.
Average absorption spectra
Furthermore, to analyze various light absorption ranges and identify the curve's peaks, average absorption spectra were generated for the cultures under both treatments, revealing characteristic peaks in the regions associated with photosynthetic pigments: a main peak around 430 nm and another near 680 nm, corresponding to the absorption bands of chlorophylls a and b. Additionally, under white light illumination, a marked increase in absorbance was observed in the ultraviolet region (~310 nm), attributable to the presence of MAAs.
Comparatively, although the behavior was quite similar between both types of cultures, the cultures exposed to white light showed higher absorbance intensities across the UV-visible spectrum, with clear peaks at about 430 nm and 680 nm. This suggests both a higher cell density and an enhancement in the production of photoactive secondary metabolites.
The specific analysis of absorbance at 310 nm revealed average values of 0.273 ± 0.051 for white light and 0.223 ± 0.037 for red light. Similarly, the average absorbance at 430 nm was 0.314 ± 0.043 (white light) versus 0.233 ± 0.031 (red light).
To evaluate the significance of these differences, a one-way analysis of variance (ANOVA) was performed. The results were as follows: For absorbance at 310 nm (MAAs): F = 9.06, p = 0.0131. For absorbance at 480 nm (Carotenoids): F = 7.67, p = 0.0198. In both cases, the p-values were less than 0.05, indicating that the observed differences between the white light and red-light treatments were statistically significant.
Production of mycosporine-like amino acids and carotenoids. Some representative curves for the three groups of samples are shown in Figure 1. From these absorbance values and using equations (2) and (3) were calculated the total carotenoids concentrations and MAAS shown in Table 3. Maximum absorbance wavelength was near 430nm for white led light growths, and there is a clear difference between those cultures and the red light ones which exhibited less absorbance at those wavelengths.
|
Number |
Carotenoids |
MAAs |
|
1 |
17.98±1.48 |
48.94±2.13 |
|
2 |
25.56±1.26 |
99.54±1.02 |
|
3 |
153.5±3.90 |
137.92±6.5 |
Table 3 Results of carotenoid and MAA production
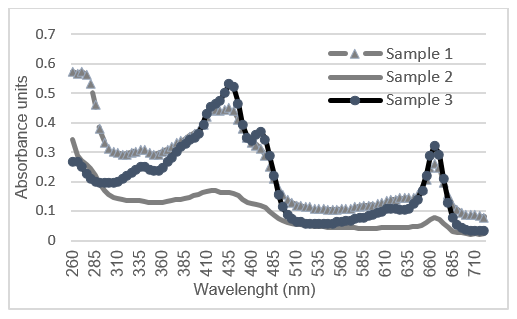
Figure 1 Comparison of representative absorptive curves for the samples. Sample 1 corresponds to an average of white led light 16:08 growths; sample 2 to white led light 12:12 and sample 3 to red led light growths.
The analytical methods to determine carotenoids and MAAs were suggested to some limitations in the laboratory and the quantification method itself. However, a trend of greater accumulation of photoactive secondary metabolites can be seen in the treatment with red light and a 16:8 photoperiod. For carotenoids, this was five times greater than treatment 2 (white light, 12:12) and eight times greater than treatment 1 (white light, 16:8). For MAAs, it was 2.8 times greater than treatment 1.
Comparative analysis with previous studies
The increase in MAAs under broad-spectrum red light is consistent with the study by Sandoval et al. [14], who cultivated C. vulgaris with red LED light and obtained the highest values for sun protection factors and MAA concentration, although they did not obtain enough dry biomass to extract carotenoids. The production of MAAs has been exponentially improved: 0.00198 mg g⁻¹ of dry matter previously versus 137.92 mg MAAs g⁻¹ of dry matter in this work, and carotenoids were obtained, something not achieved in the previous work. Regarding carotenoids, it has been demonstrated that slight variations in spectral composition divert the carbon flux towards the mevalonate pathway19 significantly increasing the accumulation of antioxidant pigments. Therefore, the effect of using LED tape around the photobioreactor, as opposed to an external lamp,17 improves light distribution and, consequently, increases carotenoid production.12
Regarding results from other authors, Yusof et al.20 found 0.264 ± 0.031 mg of carotenoids per gram of dry matter with Chlorella vulgaris, albeit under different conditions. In this work, the maximum content of carotenoids was obtained with red light at 16:08, and corresponds to 12.76 mg of carotenoids per gram of dry matter. Other recent work regarding Chlorella vulgaris characterization indicates a maximum production of 3.77 ± 0.01 mg of carotenoids per gram of dry matter.21 In the other hand, based on the review conducted, there are no other recent works on obtaining MAAs from this microalga.
Finally, a recent meta-analysis confirmed that the combination of spectra (red + blue) and extended photoperiods acts synergistically to maximize both biomass productivity and metabolite content in chlorophytes.12 Overall, the results of that work align with many of the present one and bibliographic findings. Furthermore, the present work constitutes a starting point for building an effective strategy to direct the manufacturing of high-value compounds in microalgae cultures, aiming to make wastewater treatment22 and greenhouse gas capture23 profitable within a biorefinery approach.24
This study demonstrates that the type of light—not only its wavelength but also the way it is distributed—as well as the photoperiod, significantly influence the production of secondary metabolites of biotechnological interest, particularly mycosporine-like amino acids (MAAs) and carotenoids. These are called photoactive compounds and are necessary for manufacturing environmentally friendly sunscreens. Cultures exposed to white light, which contains high-frequency energy components (UV and blue), showed statistically significant increases in absorbance at 310 nm and 430 nm, which are indirect indicators of greater synthesis of MAAs and carotenoids, respectively.
On the other hand, although red light did not promote overall biomass growth, it effectively stimulated the production of these bioactive compounds. This confirms that not only the quantity but also the functional quality of the algal biomass critically depends on the lighting conditions used. In applied terms, the results suggest that for industrial cultures aimed at obtaining natural sun filters, antioxidants, or high-value-added compounds for the cosmetic and pharmaceutical industries, it is preferable to use broad light spectra (white light type) under controlled photoperiods.
Finally, this research supports cultivation strategies based on the manipulation of the light spectrum as effective tools to direct the secondary metabolism of microalgae. Future studies should explore spectral combinations enriched with blue light, as well as controlled stress conditions (e.g., nutrient limitation), to further optimize the production of these and other metabolites of interest within a circular economy framework.
None.
Author contributions
Juan Sandoval-Herrera: Conceptualization, investigation, methodology, and writing-original draft.
Christopher Gómez: Supervision, validation, review, and editing.
Sebastian Rivera: Investigation, methodology, analysis, review, and editing.
Data availability statement
The datasets used and/or analyzed during the current study are available from the corresponding author on reasonable request.
None.
The authors declare no competing interests and non-financial competing interests.

©2025 Sandoval-Herrera, et al. This is an open access article distributed under the terms of the, which permits unrestricted use, distribution, and build upon your work non-commercially.
