Journal of
eISSN: 2373-4345


Research Article Volume 2 Issue 3
1Department of Restorative Dental Sciences, King Saud University, Saudi Arabia
1Department of Restorative Dental Sciences, King Saud University, Saudi Arabia
Correspondence: Alhnaouf A Alhabdan, Department of Restorative Dental Sciences, King Saud University, Riyadh, Saudi Arabia, Tel 967000000000
Received: April 14, 2015 | Published: May 21, 2015
Citation: Alhabdan AA, Hejazi AAE. Comparison of surface roughness of ceramics after polishing with different intraoral polishing systems using profilometer and SEM. J Dent Health Oral Disord Ther. 2015;2(3):101-111. DOI: 10.15406/jdhodt.2015.02.00050
Purpose: To evaluate the effects of the different available intraoral ceramic polishing systems on the surface roughness of the latest ceramic materials.
Methods: Eighty ceramic discs (5mmx2mm) were prepared from 2 ceramic materials (VM9 and e.max) using stainless steel mold. The discs were then randomly divided into 4 subgroups for each material (n=10). A Fine diamond bur was used to remove the glaze layer on one side of the disc (the other side serving as a control), and the samples were then polished by one of the 4 polishing systems (Sof-lex discs, Optrafine, EVE, and Jazz). Surface roughness was measured quantitatively by Profilometer and qualitatively by SEM. Three roughness readings were taken for each sample before being polished, after removal of the glaze layer, and after being polished.
Results: The mean Ra value for the glazed surface (control) was (Ra=0.557). The lowest mean Ra value was recorded for the Sof-lex polishing system with the e.max material (Ra=0.195). The highest mean Ra value was recorded for the Jazz polishing system with the VM9 material. There was no statistically significant difference between Optrafine and EVE with VM9 and Sof-lex, Optrafine and EVE with e.max.
Conclusion: The use of ceramic polishing kits was effective in reducing surface roughness. The polished ceramic samples were as smooth as their controls. Therefore, any needed adjustment to the ceramic restoration can be achieved by the use of a ceramic polishing kit, without the need for glazing.
Keywords: dental ceramics, polishing, glazing, surface roughness, profilometer, scanning electron microscopy, polishing kits
SEM, scanning electron microscopy; AFM, atomic force microscopy; RMS, root-mean-square; ANOVA, one-way analysis of variance
All surfaces of tooth-colored restorative materials are required to be smooth and esthetically pleasing. With ceramic restorations, the glaze process helps to achieve a smooth surface and retains high luster for a long period of time. However, during clinical try-in of any ceramic restoration it is necessary to check and adjust any occlusal interference. After occlusal adjustment, the restoration is returned to the laboratory for final glazing. Sometimes, after the glazed restoration has been permanently cemented additional surface modifications may be necessary to correct minor interferences. These additional adjustments to the glazed ceramic surface can lead to the removal of the surface glaze and exposure of the underlying unglazed rough ceramic surface. Unglazed ceramics may increase plaque retention,1,2 increase wear on the opposing teeth3,4 and reduce the strength of the ceramic material.5,6 Because a rough surface has more pits and grooves, these surface irregularities may reduce the efficiency of mastication and mechanical cleaning processes and enhance the initial adhesion of bacteria and their subsequent colonization to form a biofilm and plaque.7 Therefore, careful intraoral finishing and polishing of the ceramic surfaces using the proper technique and materials are recommended.
The different applications of ceramics in dentistry require different mechanical properties. Therefore, several dental ceramics have been introduced that differ in their mechanical properties as well as chemical composition.8 Ceramics can be categorized into glass ceramics and high-strength core ceramic son to which an esthetic layering ceramic must be applied to achieve a natural appearance.9–11 Glass ceramics are conventional sintered feldspathic, Lucite or lithium disilicate ceramics that have SiO2 as the main constitutes. These are used for inlays, on lays, and a veneering material of alloys and high-strength core ceramics.8 The second type is opaque layered materials that are nonmetallic restorations made with alumina, zirconium or lithium disilicate used as high-strength core materials such as IPSe.max,1 Procera,2 In-Ceram,3 Lava,4 and Cercon.5,12
The glaze process helps to achieve a smooth surface and retains high luster for a long period of time. Natural glaze is a verified layer that forms on the surface of ceramics and contain a glass phase when the ceramic is heated to a glazing temperature for a specific time. However dental over glazes are composed of colorless glass powder that is applied to the fired crown surface to produce a glossy surface.13 In addition, the glazing procedure is known to increase the overall mechanical strength of ceramic restorations in 3 ways: reducing porosity, reducing the depth and sharpness of surface flaws, and blunting the flaw tips.14 Therefore, careful intraoral finishing and polishing of the ceramic surfaces using the proper technique and materials are recommended to ensure the clinical success of these restorations.15
Reglazing has the advantage of decreased chair time for the patient. However, because reglazing is performed at the dental laboratory with the use of a temperature furnace, it requires multiple office visits.16 Yilmaz K et al.17 found that repeated firings have a destructive effect on the glaze layer and deform the surface. Conversely, polishing is easy, simple, and can be done during a single session with no effect on the physical properties of ceramic. Despite the fact that a highly polished ceramic surface can be achieved, however, it is time-consuming and the final smoothness depends mainly on the type of ceramic material and the polishing technique used.16 Al-Wahadni A18 stated that any adjusted dental porcelain should be re-glazed, and if this is impossible, that sequential finishing followed by a final stage of polishing with diamond paste should be performed. Nakamura Y19 found that ceramic polishing results in high flexural strength that is comparable with that of glazed ceramics. However, a study by Karan S et al.20 concluded that the final roughness of the polished ceramic surfaces was greater than that of the original glazed surface. Different ceramic materials exhibit different surface roughness after being glazed or polished. Leucite-reinforced feldspathic21 and lithium disilicate ceramics22 are both translucent materials that exhibit excellent esthetic and mechanical properties, and are suitable for use as an esthetic single restorations or as veneering materials for a high-strength core. Sasahara RM16 concluded that lower leucite content tended to present lower roughness compared with higher leucite content after being polished with rubbers or discs followed by diamond pastes. Further, they noted that finding the appropriate polishing method for each ceramic is extremely difficult because of variations in ceramic microstructures. Moreover, Al-Wahadni A18 found that high crystal content in a ceramic material could lead to an uneven surface when the material is polished. A study by Al-Shammery HA et al.23 confirmed that different materials require different polishing techniques.
There are many ceramic polishing systems available in the marketplace. These systems are usually composed of a variety of materials such as diamond burs, fluted carbide burs, rubber wheels, rag wheels, mounted points, abrasive stones, sandpaper discs, and diamond paste.16 Fahmy NZ6 found that polishing caused a reduction in initial surface flaws and defects, inhibiting further crack propagation, thus increasing the restoration’s resistance to fracture. Moreover, polishing might produce residual compressive strength, thereby increasing ceramic surface hardness. Polishing systems containing discs were found to be more effective than the polishing pastes used alone or combined with Sof-lex discs.24
Surface roughness has been investigated by several methods and devices such as: Visual assessment, scanning electron microscopy (SEM), Profilometer, laser specular reflectance, or atomic force microscopy (AFM).3 Commonly, Profilometer devices are used for assessing the roughness of a material’s surface. The Profilometer determines the profile along 3 lines on the surface by means of a tracking device.1 Many parameters can be assessed by Profilometer devices, with the most common being average roughness deviation (Ra), root-mean-square (rms), and roughness deviation (Rq).1 The Ra parameter describes the overall roughness of a surface and can be defined as the arithmetic average value of all absolute distances of the roughness profile from the centerline within the measuring length.24 Some in vivo studies25,26 suggest an ideal threshold surface roughness for bacterial retention to be (Ra=0.2μm). In contrast, enamel roughness is also reported to be a guideline parameter, but it depends on the tooth type and location in the oral cavity.27
The aim of this study is to evaluate the effect of four different intraoral ceramic polishing systems available on the market on the surface roughness of the latest ceramic materials (i.e., Vita VM9 and e.max) as compared with their glazed surfaces. The specimens are quantitatively evaluated using a Profilometer (Ra value) and qualitatively using Scanning electron microscope (SEM) micrographs.
1Ivoclar Vivadent, Schaan, Principality of Liechtenstein
2Nobel Biocare, Göteborg, Sweden
3Vita Zahnfabrik, Bad Säckingen, Germany
43M ESPE, St. Paul, Minn., USA
5Dentsply Ceramco, York, Pa, USA
Specimen preparation
Eighty ceramic disks (5mm x 2mm) (Figure 1) were fabricated from 2 different ceramic materials Vita VM9* (ENL 191, Vita Zahnfabrik, Germany) and IPS E.max (Enamel shade A1), (IvoclarVivadent, USA), according to the manufacturers’ instructions in a standardized stainless steel mold with disc-shaped holes. Forty ceramic disks were fabricated from each material (Table 1). Ceramic specimens were fabricated by the powder condensation technique. The ceramic powder was mixed with sculpting liquid and placed into the mold. The obtained slurry was blotted with tissue to eliminate excess water and further compacting of the ceramic. The prepared discs were fired under vacuum according to the manufacturers’ recommendations. The specimens were allowed to cool and then were finished with a medium-grit diamond disc on both sides to remove any irregularities. Finally, specimens were soaked in distilled water for 5 minutes and placed in the porcelain-firing oven to obtain the glazed surface (Table 2). Each ceramic material was further divided into 4 different groups (n=10) according to surface polishing techniques (Table 3). To simulate the clinical situation a fine diamond bur (30μm) was used one side of each specimen to remove the glaze, and then the surface was polished by one of the 4 intraoral polishing systems tested. The roughening procedure with the diamond bur was limited to 30 seconds for each surface and was performed manually with light, intermittent pressure under water-cooling in a low-speed hand piece at 100,000 rpm. A new bur was used after 10 specimens. The other side of the disc, which was glazed according to the manufacturers’ instructions, was used as control. To differentiate between the 2 surfaces, glazed and polished, each specimen was notched on the glazed surface with a fine diamond disc.
Materials |
Code |
Lot # |
Shade |
Composition |
Manufacturers |
Vita VM9* |
VM |
36440 |
ENL 191 |
Fine-structure leucite-reinforced feldspathic veneering ceramic for ZrO2 copings |
Vita Zahnfabrik, Bad Säckingen, Germany |
IPS E. Max |
IPS |
75152 |
Enamel A1 |
Lithium disilicate glass-ceramic |
IvoclarVivadent, Schaan, Liechtenstein |
Table 1 Ceramic materials included in the study
VM9 |
Lot#18810 |
Glazing Procedure |
Closing Time |
5 min |
|
Starting Temperature |
500°C |
|
Temperature Rise |
8°C/min |
|
Final Temperature |
900°C/min |
|
Holding Time Of Final Temperature |
1 min |
|
Vacuum |
No |
|
E. Max |
Lot#75152 |
Glazing Procedure |
Closing Time |
1 min |
|
Starting Temperature |
403°C |
|
Temperature Rise |
60°C/min |
|
Final Temperature |
725°C/min |
|
Holding Time Of Final Temperature |
1 min |
|
Vacuum |
Yes |
|
Table 2 Glazing procedure for each material
Groups |
Sub Groups |
Lot # |
Polishing System |
G1 |
VM9 |
2380 |
Sof-lex 2382 coarse to superfine discs (3M ESPE, St Paul, Minn, USA) |
G2 |
VM9 |
PL 1862 |
OptraFine ceramic polishing system (OptraFine F, P, and HP paste/brushes; Ivoclar Vivadent AG) |
G3 |
VM9 |
232557 |
EVE Diapole ceramic polishing set (coarse, medium and fine; EVE Ernst Vetter GmbH, Pforzheim, Germany) |
G4 |
VM9 |
(Medium) |
Jazz polisher (medium and fine; S.S. White Inc., Piscataway, New Jersey, USA) |
Table 3 Details for all groups
Polishing procedure
Polishing was done according to the manufacturers’ instructions of different intraoral polishing systems used. Polishing was performed by the same investigator using a slow-speed hand piece according to the manufacturers’ instructions (Table 4, Figure 2).
Methods |
Polishing Instrument |
Revolution Per Minute |
Water- Cooling |
Time Per Instrument (Sec) |
Total Processing Time (Sec) |
G1 |
1. 2382C coarse |
≤15,000 |
- |
30 |
120 |
Sof-lex |
2. 2382M medium |
≤15,000 |
- |
30 |
|
3. 2382F fine |
≤15,000 |
- |
30 |
||
4. 2382SF |
≤15,000 |
- |
30 |
||
super fine |
|||||
G2 |
1. F coarse |
≤15,000 |
+ |
30 |
90 |
Optrafine |
2. P fine |
≤15,000 |
+ |
30 |
|
3. HP (brush with paste) |
≤10,000 |
- |
30 |
||
G3 |
1. W16, 18Dg |
≤12,000 |
+ |
30 |
90 |
Eve |
2. W16, 18Dmf |
≤12,000 |
+ |
30 |
|
3. W16, 18D |
≤12,000 |
+ |
30 |
||
G4 |
1. Medium grit (pink) |
≤15,000 |
+ |
30 |
60 |
Jazz |
2. Fine grit (yellow) |
≤15,000 |
+ |
30 |
|
Table 4 Polishing procedure for each system used
Surface roughness evaluation
The specimens’ surface roughness was measured quantitatively by Profilometer (Talysurf Intra 50 instrument, Tylor Hobson Ltd., 112/3477-02, series no.339, Leicester, England) before specimens were polished, after removal of the glaze layer and after specimens were polished (Figure 3). A mean roughness profile (Ra) was determined for each side of each specimen to describe the overall roughness of the surface. To measure the roughness profile value in micrometers, the equipment was calibrated so that the stylus tip would scan 0.75 mm length. One trace was recorded for each specimen at 3 different positions (parallel, perpendicular, and oblique) giving 3 tracings per sample. The average of these 3 mean surface roughness measurements was used as the score for each sample (Figure 4). The scores were entered into a spreadsheet (Excel; Microsoft, Seattle, Wash., USA) for the calculation of descriptive statistics.
SEM evaluation
One specimen per group was examined by scanning electron microscopy (JSM, 6360 LV, JEOL Corp., Tokyo, Japan) (Figure 5). The specimens were selected according to the mean surface roughness values (Ra) measured. The topographic observations of the polished surface were compared with each other as a complement to the quantitative results obtained with surface roughness assessment. The specimens were rinsed with distilled water, dried, and fixed onto an aluminum cylinder (13mm in diameter and 10mm in height). Subsequently, the specimens were sputter-coated with gold-palladium alloy (SPI-Module sputter, SPI supplies, West Chester, Penn., USA) and evaluated by SEM.
Statistical analysis
Statistical analysis of the surface roughness of polished and unpolished ceramics was performed by pairedt-testand one-way analysis of variance (ANOVA) followed by post-hoc comparison at a significance level set at a=5%.
Surface roughness evaluation
The descriptive statistics of mean Ra values (μm) of both materials (VM9 and e.max) are presented in (Table 5). The mean Ra value after VM9 was polished with the 4 polishing systems was (Ra=0.319) and that for e.max was (Ra=0.399). The lowest mean Ra value was recorded for the Sof-lex polishing system with e.max material (Ra=0.195). The highest mean Ra value was recorded for the Jazz polishing system with VM9 material. Moreover, the mean Ra value for the glazed surface (control) was (Ra=0.557). A paired t-test was used to evaluate the effects of the different polishing systems on the surface roughness of VM9 ceramic surfaces tested compared with their respective glazed surface (control). The test showed that ceramic samples polished with Optrafine (Ra=0.247) and EVE (Ra=0.276) produced statistically significantly (P<0.05) lower values than did their glazed group (Ra=0.761, 0.593 respectively). In addition, no significant difference (P>0.05) was found between Sof-lex (Ra=0.24) Jazz (Ra=0.512) and their respective glazed surfaces (control) (Ra=0.298, 0.509 respectively) (Table 5, Figure 6).
Material/Systems |
Sof-lex |
Optrafine |
EVE |
Jazz |
|
VM9 |
Glazed |
0.298 (0.11) |
0.761 (0.094) |
0.761 (0.175) |
0.509 (0.264) |
Polished |
0.24 (0.159) |
0.247 (0.546) |
0.276 (0.269) |
0.512 (0. 223) |
|
E. Max |
Glazed |
0.427 (0.278) |
0.666 (0.541) |
0.642 (0.312) |
0.533 (0.339) |
Polished |
0.195 (0.14) |
0.459 (0.191) |
0.448 (0.427) |
0.495 (0.348) |
|
Table 5 The mean Ra values (SD) by paired t-test for VM9 and E. Max of glazed and polished groups
For e.max, paired t-test was used to evaluate the effects of the different polishing systems on the surface roughness of ceramics surface tested their respective glazed surface (control). The test showed that Sof-lex discs (Ra=0.195), Optrafine (Ra=0.459), and Eve (Ra=0.448) produced statistically significantly (P <0.05) lower values than did the glazed group (Ra=0.427, 0.666, 0.642 respectively). In addition, no statistically significant difference (P <0.05) was found between Jazz (Ra=0.495) and its respective glazed surface (control) (Ra=0.533) (Table 5, Figure 7).
Further tests were carried out (one-way ANOVA test) to indicate significant interactions among the 4 polishing system (P<0.05) for the 2 materials (VM9 and e.max) (Table 6). For VM9, Tukey’s multiple comparisons test indicated that there was no statistically significant difference (P<0.05) among Sof-lex, Optrafine and Eve (Ra=0.24, 0.247, 0.276 respectively) having the lowest Ra values in this group. Moreover, there was a statistically significant difference (P<0.05) between Jazz and all other systems producing the highest Ra values (Ra=0.512) (Table 7, Figure 6). For e.max, Tukey’s multiple comparisons test indicated that Sof-lex produced the lowest Ra values with a statistically significant difference (P<0.05) between its Ra values (Ra=0.195) and those of other systems. There was no statistically significant difference (P>0.05) among Optrafine, EVE and Jazz (Ra=0.459, 0.448 and 0.495, respectively) (Table 8, Figure 7).
Material |
Sum of Squares |
df |
Mean Square |
F |
Sig. |
|
VM9 |
Between Groups |
1.517 |
3 |
0.506 |
16.619 |
0 |
Within Groups |
3.531 |
116 |
0.03 |
|||
Total |
5.048 |
119 |
||||
E. Max |
Between Groups |
1.704 |
3 |
0.568 |
6.297 |
0.001 |
Within Groups |
10.462 |
116 |
0.09 |
|||
Total |
12.166 |
119 |
Table 6 One-way ANOVA of mean Ra values of polished ceramic samples
System |
N |
Subset for alpha= 0.05 |
|
1 |
2 |
||
Sof-Lex |
3 |
0.24038 |
|
Optrafine |
30 |
0.24791 |
|
Eve |
30 |
0.27653 |
|
Jazz |
30 |
0.51276 |
|
Sig. |
0.853 |
1 |
|
Table 7 Results of post hoc tests (Tukey’s HSD, multiple range tests) showing the mean Ra values of polished ceramic samples in homogenous subsets for VM9
System |
N |
Subset For Alpha = 0.05 |
|
1 |
2 |
||
Sof-Lex |
30 |
0.19543 |
|
Optrafine |
30 |
0.44874 |
|
Eve |
30 |
0.45921 |
|
Jazz |
30 |
0.49519 |
|
Sig. |
1 |
0.932 |
|
Table 8 Results of post hoc tests (Tukey’s HSD, multiple range tests) showing the mean Ra values of polished ceramic samples in homogenous subsets for E. Max
Post-hoc test indicated similar behavior of Sof-lex, EVE and Jazz polishing systems for the two materials (VM9 and e.max). There was a statistically significant difference among the3 polishing systems with Sof-lex producing the lowest mean Ra values. Optrafine behaved differently between the 2 materials. With VM9, Optrafine produced mean Ra values that were near to those of Sof-lex polishing system. In contrast, Optrafine produced a mean Ra values with e.max material that were near that of EVE and Jazz polishing systems (Figure 8).
Qualitative SEM evaluation
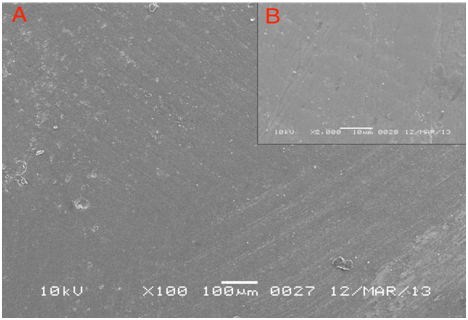
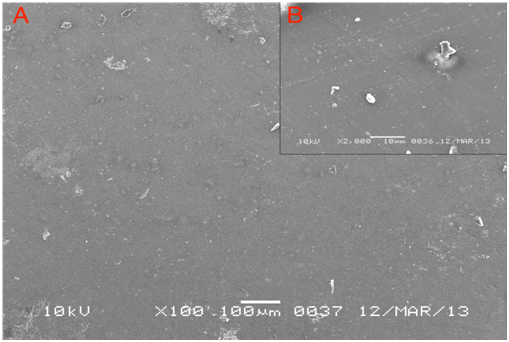
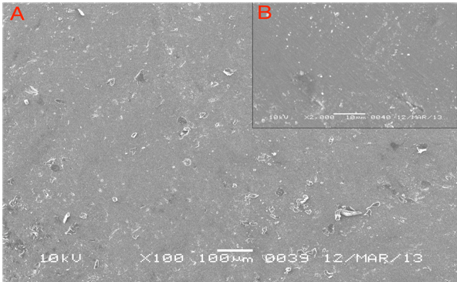
Glazed VM9 surfaces presented a regular surface morphology with small and fine irregularities and pores across the specimens (Figure 9). Surfaces polished with Sof-lex presented similar topography with slight increases in the irregularities and surface flaws presented (Figure 10). In addition, Optrafine surfaces appeared regular with some in homogeneity and residual polishing paste particles. At higher magnification (2000x), the surfaces presented with some striation and polishing paste particles appeared to have a role in filling the pores, which presented normally in the glazed samples (Figure 11). Samples polished with EVE and Jazz had more striation and fine flaws across their surfaces (Figures 12 & 13).
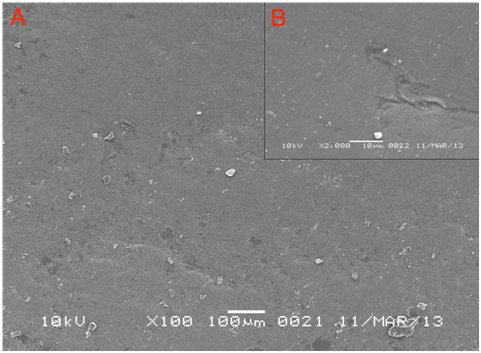
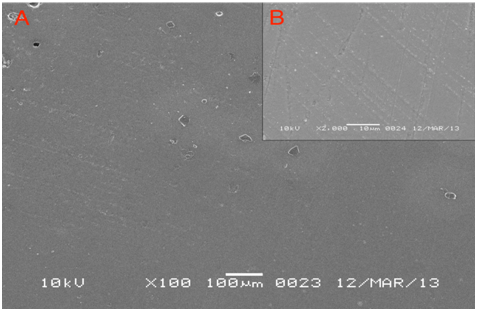
Glazed Emax sample also, showed regular morphology. However, flaws and void increased across the entire surface (Figure 14). Sof-lex surface has the same morphology as glaze sample with some scratches appeared on the whole surface (Figure 15). Sample polished with Optrafine and Eve exhibited regular morphology with some striation (Figures 16 & 17). Jazz sample showed increase irregularities and flaws (Figure 18).
It is common for ceramic surfaces to require adjustment after cementation. Finishing will expose unglazed ceramics that were found to increase wear on the opposing teeth3,4 and reduce the strength of the ceramic material.5,6 There is still controversy in the literature regarding the best intraoral polishing method for ceramics that will result in a glaze-like surface. As stated previously, the surface roughness of glazed and polished ceramic surfaces were investigated, and it was reported that polishing could produce surface comparable with that of a glazed surface.5,13,24,28 In this study, the efficiencies of 4 ceramic polishing systems were compared with each other and with 2 different ceramic materials (VM9 and e.max). These systems were selected as being intraoral, quick and efficient polishing systems, easy to use, and specially recommended for use on ceramics. Ceramic discs were carefully standardized in a stainless steel mold with4 disc-shaped holes for ceramic powder condensation. Each disc was 5mm in diameter and 2mm in thickness. The base of each hole was attached to a spring for easier removal of condensed ceramic powder without damaging the edges. Ceramic powder was condensed in the holes by a powder condensation technique.13,24,29 Each disc was then pushed out by means of the handle attached to each hole, for firing and glazing.
The use of Ra to describe surface roughness is widely established in dentistry, especially with tactile Profilometry. A Ra value is most commonly used as a representative estimate of surface roughness. Sarikaya I et al.24 stated that, “Ra parameter describes the overall roughness of a surface and can be defined as the arithmetical average value of all absolute distances of the roughness profile from the center line within the measuring length”. Moreover, it is easy to measure and the machine is available and affordable. Two types of Profilometer are available contact and non-contact devices. Non-contact devices usually used a light beam or lasers to scan the surface. However, this method can lead to false values when used with shiny surface such as ceramics.25 This is due to the scattering effect of the reflected light. Therefore, a contact device was used in this study. In the present study, the opposing surface of each ceramic disc tested, either VM9 or e.max was used as a reference (control). The SEM micrograph for qualitative characterization of this surface showed it to be regular and homogenous, with small and few voids which could be a result of fabrication errors (Figures 9 & 14).
Compared with the other 3 polishing systems, Sof-lex gave the best results, with an average Ra value of 0.195 for e.max and 0.24 for VM9. These results are in agreement with those of other studies.5,24,28 The Sof-lex system composed of 4 colored discs that vary in their coarseness; these discs must be used in sequence (coarse, medium, fine and superfine) to obtain the best results as recommended by their manufacture (Figure 2). They are easy to use with flat surfaces such as buckle and palatal or on lingual surfaces. However, these discs are very difficult to manipulate on the occlusal surface of molars. Therefore other intraoral ceramic polishing systems were tested for their effectiveness and ease of use on posteriorrocclusal surfaces, since this is the most common area for adjustment after cementation of ceramic restorations. Despite the fact that Sof-lex reduced the Ra values effectively, SEM micrographs of both materials polished with Sof-lex showed numerous scratches and striations in different directions (Figures 10 & 15). This could be attributed to the rotation of the discs. In addition, Flurry S5 found that fine and superfine discs did not further reduce the Ra values of the tested ceramic samples. Moreover, they found that using fine and superfine discs could slightly scratch the ceramic surface, which was observed by the authors during SEM evaluation. Results with Optrafine and EVE showed comparable mean Ra values, with no significant difference between them with either e.max or VM9. This result is in agreement with that of Flurry et al who reported no significant difference in the mean Ra values of Optrafine and EVE.5 In addition, with VM9 Optrafine, EVE and Sof-lex showed no significant difference in their Ra values. This result could be attributing to the lower Lucite content of VM9.
VM9 is the latest in a series of Vita veneering materials with a 5 vol%-10 vol% content of refined Leucite particle size.30 This reduction in leucite particle size and content in a ceramic generally increases the strength and toughness of the material. Moreover, it improves wear kindness and polish ability of this type of ceramic.31 Sasahara RM16 found that lower ceramics with a lower leucite content and finer particle size tended to present lower mean Ra roughness values compared with those with higher leucite content after being polished. Conversely, e.maxis composed of 70 vol% crystalline lithium disilicate filler in a glass ceramic matrix. This dense composition can be a reason for the higher mean Ra values compared with that of VM9, because it is difficult to polish.17
The Optrafine system consists of 2-rubber points (Optrafine finisher and polisher) followed by a final polishing step with an HP brush and polishing paste (Figure 2). The EVE method consists of 3 rubber points (Eve coarse, medium and fine) (Figure 2). While there was no significant difference in the mean Ra values between the Optrafine and EVE system with VM9 and e.max, qualitative SEM micrograph showed that ceramic discs polished with Optrafine had fewer cracks and flaws, and that the polishing paste particles filled any open flaws and void present after samples were polished with the first rubber point (Figure 11).
The Jazz polishing system consists of only 2 rubber points (medium and fine) (Figure 2). The Ra values associated with this system had the poorest results with both ceramics studied, and in the literature there is no study investigating this system. However, there was no significant difference between the mean Ra values of Jazz and its respective glazed (control) surfaces. In addition, there was also no significant difference among the mean Ra values of Jazz, Optrafine and EVE when used on e.max in general. This could be attributed to the e.max ceramic structure, which is difficult to polish as stated previously. The results with the Jazz system indicate that it is the least efficient system tested in this study. SEM micrographs of this system showed extensive voids and cracks that can be a result of the poor performance of this system. The 2 rubber points were either not sufficient to produce a smooth surface with e.max or could be a result of a fabrication error (Figures 13 & 18). Comparing the effect of the 4 polishing system against the two materials (VM9 & e.max). The data in this study showed that there was no significant difference in the mean Ra values between vm9 and e.max for each of the polishing system except for the Optrafine polishing systems, which behave differently according the material tested(VM9 and e.max). Optrafine produced lower Ra values in VM9 than e.max and this could be attributed to the leucite content ofVM9, which can be polished easily and effectively. Also, the use of polishing paste could be the reason for this good result as stated previously.
Qualitative SEM micrographs were used to combine quantitative values were obtained by Profilometry and their respective surface topographies. In this study, micrographs were taken at 100x and 2000x to give general and specific views of the surfaces measured. However, Scurria MM et al.15 advised against the use of SEM micrographs, since, at 100x, the surface will be in distinguishable, and at higher magnification the surface will be too small to be used as a representative of the whole surface. Conversely, since that study was published in 1994, SEM machines have undergone significant development in resolution and ability to scan. Moreover, in this study, SEM micrographs were used as adjuncts to Ra values, to obtain general information about surface topography. Finally, this study hypothesized that there is no difference between polished and glazed ceramics and that the different ceramics polishing systems would have different effects on the surface roughness of the ceramic materials tested. The research hypothesis was rejected by the results; since significant differences were found in mean Ra values among the groups. It was observed that lower mean Ra values were observed with the Sof-lex polishing system, and that higher mean Ra values were observed with the Jazz ceramic polishing kit.
Within the limitation of this in vitro study, the following conclusions were drawn:
None.
None.
The authors declare that there is no conflict of interest.

©2015 Alhabdan, et al. This is an open access article distributed under the terms of the, which permits unrestricted use, distribution, and build upon your work non-commercially.