Journal of
eISSN: 2373-4345


Research Article Volume 6 Issue 2
1Department of Orthodontics, Faculty of Dentistry University Kebangsaan Malaysia, Malaysia
2Speech Sciences Program, Faculty of Health Sciences, University Kebangsaan Malaysia, Malaysia
Correspondence: Khairil Aznan Mohamed Khan, Department of Orthodontics, University Kebangsaan Malaysia, Jalan Raja Muda Abdul Aziz, 50300 Kuala Lumpur, Malaysia, Tel 603-92897747
Received: January 20, 2017 | Published: January 30, 2017
Citation: Khan KAM, Ibrahim SN, Hamid BA. A prospective evaluation of speech distortion among patients wearing Hawley retainer using acoustics approach. J Dent Health Oral Disord Ther. 2017;6(2):50-55. DOI: 10.15406/jdhodt.2017.06.00194
Background: Orthodontic retainers constrict the oral cavity’s dimension and restrict tongue movement during articulation, resulting in distortions of various sounds. Speech impairment is among the main reason for poor patient compliance in wearing the retainers which leads to treatment relapse.
Objectives: To determine and describe the changes of the distorted sounds in patients wearing upper and lower Hawley retainer.
Materials and methods: Sixteen orthodontic patients who were at the end of fixed appliance phase were included as subjects in this study. They were all speakers of native Malay, aged between 15 to 31 years old. The sound sample of selected phonemes with /t/, /d/, /k/ and /n/ consonant were recorded from the subjects before wearing (T0), immediately after wearing retainers (T1), and at 1 week (T2), 2 weeks (T3), 1 month (T4), 2 months (T5) and 3 months (T6) of wearing the retainers. Based on the recordings, acoustic analysis was performed objectively on each subject to determine the duration value of selected phonemes at each interval.
Results: All phonemes tested showed significant speech distortion (p<0.008) immediately after wearing the retainers. After one week, /k/ sound showed marked improvement in all subjects. Significant distortion of /n/ sound was recorded (p<0.008) for up to 2 months. No significant speech distortions were recorded after 3 months (p>0.008).
Conclusion: A marked distortion of /t/, /d/, /k/ and /n/ consonant sounds were observed in patients during the initial wearing of Hawley retainer. Patient needs to be well informed of the changes and encouraged for constant wearing. With good cooperation, speech will be adapted to normal pattern within 3 months.
Keywords: speech distortion, hawley retainer, acoustic analysis
Retention is an important phase of orthodontic treatment that attempts to maintain teeth in their corrected positions after active tooth movement.1 Without a phase of retention there is a tendency for the teeth to return towards their initial positions (relapse). The aetiology of relapse is not fully understood, but relates to a number of factors, including periodontal and occlusal factors, soft tissue pressures and growth.2 To prevent relapse, almost every patient who has orthodontic treatment will need to use either a removable or a fixed retainer. Although many types of retainers are available, Hawley retainer are commonly used in this country due to its durability, adjustable and cost effective. The Hawley retainer was designed by Charles Hawley in 1919 and has become the most popular removable retention appliance. The appliance generally has Adam’s clasp on the first molars and a ‘U’ loop labial bow lying against the incisors (Figure 1). The acrylic contacts the palatal surface of the teeth all the way around the arch.3 Because retainers are removable, patient compliance is an important factor in almost all cases. Stewart et al.4 did a survey to assess the patient's point of view in term of orthodontic appliance wear. They found that the removable appliance or retainers are much better than fixed appliances, except that removable retainer has cause difficulty in speaking, swallowing and increase salivary flow. The study also noted that during wearing the appliances, the first 4-7 days were the critical time for the patients to have general discomfort and difficulty in performing normal oral functions. Oliver & Evans5 showed that tendency for poor articulation occurred with smaller or constricted oral cavity dimensions. Laine T6 also concluded that subjects with a slightly narrower palate showed a tendency to have distortion of /s/ sound. Similarly, the upper and lower retainers may constrict the dimensions of the oral cavity and restrict the movement of tongue during articulation, resulting in distortions of various sounds.7 The impairment is temporary, varying from a few days to a few weeks. However, Stewart et al.4 reported that the speech impairment would persist even after 3 months. The effects of Hawley retainer on speech have been extensively studied during the past decades.7–9 However, the assessments of speech sounds were done subjectively (perceptual phonetics) using an articulation test which was conducted by an experienced speech therapist. Kulak Kayikci et al.10 was the first study looking at the effect of the Hawley appliance on speech clarity objectively by using acoustic analysis. PRAAT (Dutch for 'talk'), created by Paul Boersma and David Weenink of the Institute of Phonetic Sciences, University of Amsterdam, is currently among the most popular spectrography analysis software packages and it can be freely downloaded from the following website: It is a very flexible tool that can do acoustic analysis of speech and voice samples. The software can also generate waveforms, wide and narrow band spectrograms, pitch tracks; segment and label words, syllables, or individual phonemes; show an intensity contour and measure voice onset time (VOT). To date, limited number of studies has been done to assess objectively the speech distortion among patients wearing Hawley retainer. Therefore, the aim of this study was to prospectively evaluate the speech distortion among patient wearing Hawley retainer through acoustic approach by using PRAAT Software.
Subjects and study design
This prospective study was approved by the Ethics Committee of Universiti Kebangsaan Malaysia Medical Centre (UKMMC 1.5, 3.5/244/DD/2014/05291). Sample size calculation was done using Sample Size calculators (CTSI/UCSF)11 for before-after study (Paired T-test) with a significance level of 0.05 was used. The formula is shown below:
α(two−tailed) =0.050, β=0.200, E=0.700, S (Δ) =1.000
The standard normal deviate for α= Zα =1.960
The standard normal deviate for β= Zβ =0.842
A=1.000 B=(Zα+Zβ)²= 7.849 C=(E/S(Δ))²= 0.490
AB/C=16.02
Using the formula given, sixteen subjects would be sufficient for the study. However, target sample size was increased to be 20 subjects in allowing possible dropout rate of 20%, Twenty subjects who were at the end of fixed orthodontics treatment (near debonding phase) in the Department of Orthodontics, Faculty of Dentistry, Universiti Kebangsaan Malaysia (UKM) were recruited in the study. The inclusion criteria were native Malay speakers (regional language) and age range between 15 to 35 years old. The exclusion criteria were individuals with cleft lip, cleft palate and a history of speech and hearing disorders. All subjects were explained about the study and consent was obtained from the subjects or the guardians before being recruited.
Procedure
At debonding appointment, all brackets and bands were removed from each subject. Then, alginate impressions (Kromopan, Lascod, Italy) of the upper and lower arch were taken and immediately sent to the lab for the construction of the retainer. The design is Adam’s clasps with 0.7 mm diameter stainless steel wire on the first molars and a labial bow with 0.7mm diameter stainless steel wire which span from canine to canine (Figure 1). The acrylic part (Impact Orthodontic Resin) was kept at a uniform thickness of 2 to 3mm on the palatal for each retainer, as suggested by Kulak Kayikci et al.10 All retainers were constructed by a single technician. On the next day, prior fitting of the retainer, speech samples were recorded from each subject and used as a control (T0). The recordings were performed using Sony IC Recorder ICD-SX700/SX800 in a quiet room as to minimize background sound. The recorder was placed close to subjects’ mouth (Figure 2) and each subject was asked to read loudly a list of selected Malay words with /t d k n s/ phonemes. These phonemes were chosen to be analyzed as from our clinical observation; these were thought to be the most likely affected in Malay patient’s daily pronunciation. The words with phonemes given to subjects are: tali for phoneme /t/, dadu for phoneme /d/, kuku for phoneme/k/, nasi for phoneme /n/, and susu for phoneme /s/.Three recordings were obtained for each word. Once the initial recording was completed, upper and lower retainers were fitted to the subjects. The subjects were explained on how to wear and remove the retainer and were instructed to wear them for 24 hours a day except during eating and brushing. Then, the recordings were repeated again using the same selected words (T1). The recording was then repeated at the following intervals:
Acoustic analysis
The speech samples collected were transcribed into the PRAAT software version 5.3.56 to assess the acoustic characteristics of the sound via spectrographic analysis. The speech waveform was set at a sampling rate of 24000 hertz (in order to preserve the high frequency detail of fricatives) for all words. The samples were displayed in the spectrogram view to determine the segment duration for each of the phonemes. By using spectrogram analysis, Voice Onset Time (VOT) values for plosives phonemes /t d k/ and voicing duration for the nasal /n/ and fricatives /s/ were measured in milliseconds (ms). The measurements were done by manually placing cursors at the beginning and end of the segment being studied (Figures 3A–3E). The average VOT values and voicing duration from the three readings were obtained for each phoneme (/t d k n s/). The results from the spectrogram analysis by Praat software were recorded in the analysis form.
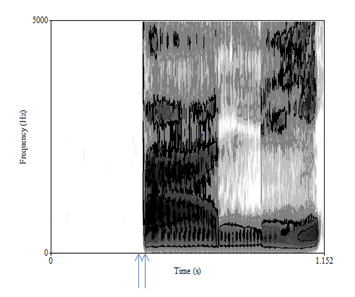
Figure 3A Spectrogram display of the /t/ sound in early words of “tali” in Malay. The period between the 2 arrows is the VOT values of the /t/ sound (in milliseconds).
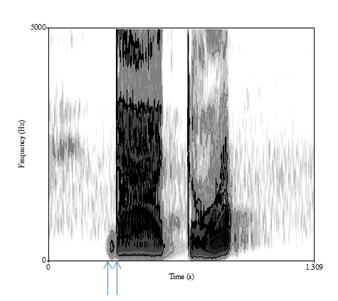
Figure 3B Spectrogram display of the /d/ sound in early words of “dadu” in Malay. The period between the 2 arrows is the VOT values of the /d/ sound (in milliseconds).
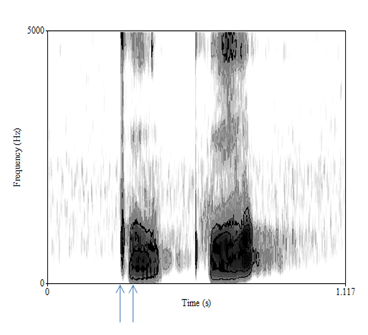
Figure 3C Spectrogram display of the /k/ sound in early words of “kuku” in Malay. The period between the 2 arrows is the VOT values of the /k/ sound (in milliseconds).
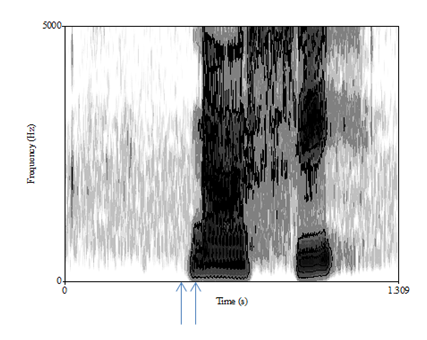
Figure 3D Spectrogram display of the /n/ sound in early words of “nasi” in Malay. The period between the 2 arrows is the voicing duration of the /n/ sound (in milliseconds).
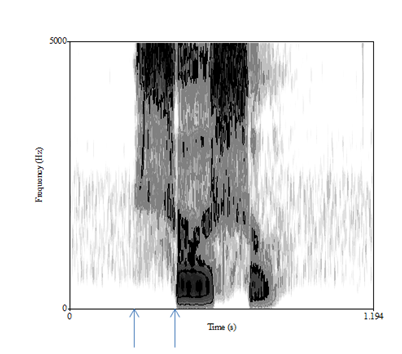
Figure 3E Spectrogram display of the /s/ sound in early words of “susu” in Malay. The period between the 2 arrows is the voicing duration of the /s/ sound (in milliseconds).
Statistical analysis
Analyses of the data were performed with the Statistical Package for Social Science (SPSS) software for Windows version 23.0. The Shapiro-Wilk normality test was performed to check for normality. A one-way repeated measures ANOVA (Analysis of Variance) was used to compare mean duration (in milliseconds) of each phoneme at different time interval and paired samples t test with a Bonferroni adjusted α of .008 was used to compare mean duration (in milliseconds) of each phoneme after wearing retainer to mean duration before wearing retainer (control). In order to gauge the consistency, 210 utterances were re-measured two week after the original analysis. The intra-examiner reliability test was performed using Intra-class Correlation Coefficient test (ICC) between the original and the repeated measures. There was statistically significant correlation of the measurements with an r>0.98. This suggests that there was a good degree of intra-examiner reliability in the application of the segmentation and measurement criteria described above.
Table 1 shows demographic characteristic of study population. The final sample size consists of 16 subjects due to 4 subjects failed to attend the follow-up appointments. The mean age of the subjects were 23 years old which consists of 5 male and 11 female. All participants were native Malay ethnic and speaker. Table 2 shows the F and p-values of the one-way repeated measures ANOVA analysis, mean voice onset time (VOT) and voicing duration (in millisecond) for the sounds and the standard deviations (SDs). Statistically significant distortion in VOT and voicing duration were recorded with /t/, /d/, /k/ and /n/ sounds (p<0.05). No significant distortion was noted for phoneme /s/. Table 3 shows a paired samples t test comparing before and after (T1-T6) wearing of the retainer using mean difference of duration (in milliseconds) of each phoneme. To maintain a family-wise alpha rate of .05 over multiple comparisons, a Bonferroni corrected alpha level of .008 was used. The results showed that there was statistically significant sound distortions of /t d k n/ phonemes immediately after the subject were fitted with the upper and lower Hawley retainer on the first day (T1). After one week (T2), improvement of /k/ sound was recorded (p>0.008) while significant distortion were still noted with /t d n/ sound. At the second weeks (T3), significant distortion (p>0.008) were only recorded with /d/ and /n/ sound. After one month (T4) and two months (T5), the only significant distortion was recorded with /n/ sound. No significant sound distortions were recorded at 3 months (T6) (p>0.008). Figure 4 shows the changes of mean VOT values for /t d k/ plosives sounds and voicing duration for /n/ nasals and /s/ fricatives sounds (in millisecond) from T0 (before wearing the retainer) until T6 (3 month post retention). It is noted that there is a marked difference in mean VOT and voicing duration between T1 (immediately after wearing retainer) and T0 (before wearing retainer). However, there seems to be an improvement of each sound towards control means (T0) in a progress of time.
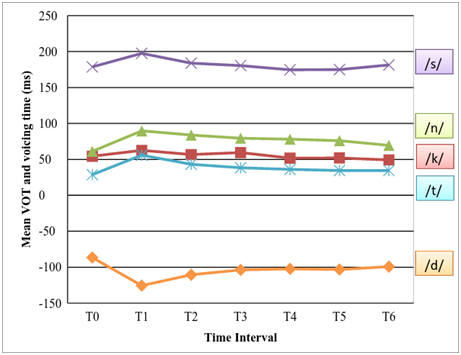
Figure 4 The changes of mean VOT values for /t d k/ sounds and voicing duration for /n s/ sounds at different time interval.
|
Demographic data |
Distribution |
|
n |
% |
||
Gender |
Male |
5 |
31.2 |
Female |
11 |
68.8 |
|
Table 1 Demographic characteristic of study population
Sounds |
F-Value |
Mean ±SDs |
p-value |
||||||
T0 |
T1 |
T2 |
T3 |
T4 |
T5 |
T6 |
|||
/t/ |
F (3,40) = 12.93 |
28.75 ±8.83 |
55.92 ± 22.41 |
43.18 ± 19.07 |
38.37±13.95 |
36.09 ± 13 |
34.53 ± 9.58 |
34.54 ± 10.96 |
0 |
/d/ |
F (5,75) = 5.46 |
-86.54 ± 18.3 |
-125.56 ± 48.18 |
-110.52 ± 37.83 |
-103.72±30.38 |
-102.24 ± 39.33 |
-103.18 ± 38.93 |
-99.18 ± 37.56 |
0 |
/k/ |
F (5,70) = 4.92 |
54.43 ± 15.21 |
62.57 ± 14.83 |
56.73± 17.22 |
59.45±18.38 |
51.8 ± 13.98 |
51.98 ± 15.56 |
49.23 ± 12.61 |
0.001 |
/n/ |
F (5,75) = 7.97 |
61.19 ± 17.48 |
89.73 ± 29.85 |
83.87 ± 24.15 |
79.43±24.9 |
78.1 ± 22 |
76.02 ± 21.92 |
69.54 ± 19.3 |
0 |
/s/ |
F (4,66) = 1.84 |
178.67 ± 30.61 |
197.5 ± 42.45 |
183.85 ± 39.06 |
180.47±36.97 |
174.61 ± 27.15 |
174.88 ± 32.3 |
181.37 ± 37.69 |
0.126 |
Table 2 The F statistics with p-values and mean VOT and voicing time ± SDs (in milliseconds) of the sounds
Sounds |
Within 24 Hours T1 |
After 1 Week T2 |
After 2 weeks T3 |
After 1 Month T4 |
After 2 Months T5 |
After 3 Months T6 |
||||||
Mean |
SD |
Mean |
SD |
Mean |
SD |
Mean |
SD |
Mean |
SD |
Mean |
SD |
|
/t/ |
27.17* |
23.52 |
14.44* |
18.93 |
9.62 |
14.97 |
7.35 |
13.53 |
5.78 |
10.5 |
5.79 |
10.35 |
/d/ |
39.02* |
38.42 |
23.98* |
26.64 |
17.18* |
19.39 |
15.7 |
32.61 |
16.64 |
26.84 |
12.64 |
26.11 |
/k/ |
8.15* |
10.24 |
2.31 |
11.72 |
5.02 |
13.66 |
-2.63 |
9.53 |
-2.45 |
10.1 |
-5.2 |
8.29 |
/n/ |
28.54* |
22.13 |
22.68* |
17.71 |
18.24* |
20.49 |
16.91* |
16.8 |
14.83* |
17.32 |
8.35 |
19.78 |
/s/ |
18.83 |
29.28 |
5.18 |
42.32 |
1.8 |
28.05 |
-4.06 |
23.96 |
-3.79 |
28.5 |
2.7 |
36.74 |
Table 3 Mean difference of duration (in milliseconds) of each phoneme after the application of retainer in comparison with no retainer status
Paired samples t test, *p<0.008
Twenty subjects were recruited initially but only 16 subjects remain for data collection due to 4 subjects fail to attend at the required appointments. The subjects were specifically selected to be above 15 years of age as study by Kent & Read12 has shown that the speech sound acquisition usually was judged to be complete only after the age of 12 years. Majority of the subjects were female compared to male, which is usual for orthodontic treatment. The selected subjects also were all speakers of Native Malay ethnic, as to reduce the difference in language pronunciation. Majority population in Malaysia is Malay (60%) and the national language was Bahasa Malaysia.13 In this study, the consonant sounds of /t d k n s/ were analyzed as these phonemes were the most likely to have distortion of speech in patients according to literature review done.7–10 Furthermore, analysis was limited to the consonants because these sounds are much less affected by differences in dialect.14 Consonants can be classified as bilabial, labiodental, linguadental, alveolar, palatal, velar and glottal according to the place of articulation. Among these, consonants that are related to this study are alveolar which are /t d n s/ and velar, the /k/ sound. Henceforth, /t d k/ is an oral stop (plosives), /n/ is the nasal stop and /s/ is the fricative according to the manner of articulation. Subjects were given a list of words which begin with these sounds. The words that were given to subjects are: tali, dadu, kuku, nasi, and susu. These words were selected based on common words that were being used in daily conversation among the subjects. The first sound of each recorded word was used as the letter sound to be analyzed. Stop sounds at initial word position are often chosen by phoneticians to study from the acoustical perspectives due to the fact that listeners have a higher tendency to divide their attention to the beginning of a sound in a word that is being pronounced rather than the middle or the final position.15 In this study, we observed the development pattern of distorted sounds after wearing retainer, and with time, the transition to normal pattern using acoustic analysis. Speech of patients without wearing the retainer was referred as the normal pattern of speech, whilst the distorted sounds after wearing the retainer were referred as the distortion pattern. The findings of this study showed that there were prominent distortion of VOT and voicing duration pattern recorded with /t/, /d/, /k/ and /n/ sound from the start of debonding (T0) until three months post debonding (T6) (p<0.05). However, there is no significant distortion of voicing duration for fricatives /s/ sound. This might be due to subjects tend to speed up their speech when pronounce the word starting with /s/ sound. It shows that subjects have their own tricks to adapt towards speech difficulty. Among the five phonemes, /d/ sound was the only phonemes that have the negative value of mean VOT. Unlike English, Malay voiced plosives (/b/, /d/, /g/) were in negative values because the voicing occurs before the actual release of air prior to glottal closure.16 The result of the study shows that the mean VOT value for /d/ sounds was -86.54 ms during normal pattern. Otherwise the mean VOT values for other plosives consonants were 28.75 ms for /t/ sound and 54.43 ms for /k/ sound. The mean voicing duration for /n/ and /s/ sounds were 61.19 ms and 178.67 ms respectively. This is in accordance to the study16 that has been done for consonants duration, where plosives are extremely short in duration, whereas fricatives are longer. When comparing the distortion pattern of each sounds to normal pattern, there were marked distortion of /t d k n/ sounds recorded immediately after wearing the retainer (T1) (p<0.008). The similar result also found by Haydar et al.7 This is most likely due to the movement of the tongue (the main articulator) was impaired by the acrylic cover the palatal surface of the arch. Hence, it took longer time to produce the sounds, especially in alveolar sounds. After first week of wearing the retainer (T2), the recording showed that /k/ sound was shown to have improvement near to the normal pattern whilst the problem with the /t d n/ sound still exist (p<0.008). The result suggests that in producing velar sound, the tongue can adapt a very short time of period. Similar finding were also noted by Haydar et al.7 and Rai et al.17 On the second week of retainer wear (T3), there was a statistically significant transition of /t/ sound to normal pattern (p>0.008). The distortion of two alveolar sounds, which are /d/ and /n/ were still remain at the time. It took one month for /d/ sound to return into normal pattern after wearing the retainer (p>0.008). The transition of /n/ sound to normal pattern took longer, which is more than 2 months (T5) of wearing the retainer (p>0.008). None of the subjects had speech distortions during 3 months of wearing the retainer (p>0.008). The results support that the Hawley retainer do resulted in distortion of speech of certain phonemes in terms of VOT and voice duration. Nevertheless, this distortion is proven to be temporary. The result showed that the transition of distorted sounds towards normal pattern was less than 3 months with constant wearing of the retainer. Importantly, orthodontic patient needs to be well informed regarding the changes of the distorted sounds to encourage for constant wearing of the retainer. This hopefully can improve the patient’s compliance towards wearing the retainer, hence will prevent relapse. Relapse can cause a frustrated condition for the orthodontist. The effects of relapse also can cause unsatisfied patients, may require retreatment which will added cost, time, manpower. The assessment of speech disturbances may differ from language to language, and it seems that there are no published data about speech distortion following Hawley retainer wearing in subjects speaking Malay as their native language. Due to the language differences, the results of this study cannot be compared precisely with similar studies. However, the important findings of this study shows that there were some degree of sounds distortion at initial insertion of retainers and the amount of improvement of certain sounds may be noteworthy. Wearing of retainer can cause several problems to the patients, and the problem we have highlighted is the speech distortion, which can be a major concern to the patients. However, this problem has been shown to be temporary and significant improvement can be noted as the patients wear it consistently for a period of time. The findings of this study would be helpful for the clinician to understand and educate patient during orthodontic retention phase hence, improve the patient’s compliance.
None.
None.
The authors declare there is no conflict of interests.

©2017 Khan, et al. This is an open access article distributed under the terms of the, which permits unrestricted use, distribution, and build upon your work non-commercially.