Journal of
eISSN: 2572-8466


Research Article Volume 6 Issue 2
1Department of Biotechnology & Bioinformatics, California State University, USA
2Department of Biomedical Engineering, University of California Los Angeles, USA
Correspondence: Tawil Bill, Department of Biomedical Engineering, University of California Los Angeles, USA
Received: January 16, 2019 | Published: March 11, 2019
Citation: Krisha DG, Kesha P, Timothy W, et al. The effect of melatonin on fibroblasts and neuron-like cells. J Appl Biotechnol Bioeng. 2019;6(1):63-73. DOI: 10.15406/jabb.2019.06.00176
Over-the-counter sleep aids are readily available for consumption, but patients often do not use them as intended, either becoming dependant or having strong withdrawal symptoms after overuse. These medicines can cause long-term health problems and debilitating side-effects if used improperly. Diphenhydramine hydrochloride and melatonin are two components comprising a majority of the sleep aids available in the market. Their effects at the cellular level are not commonly understood. In this study, these sleep aids were tested and it was found that diphenhydramine hydrochloride at therapeutic dosages is lethal to human foreskin fibroblasts-1 (HFF-1) cells. On the other hand, melatonin was found to increase proliferation of HFF-1 cells at certain concentrations. Optimal concentrations of liquid melatonin for proliferation of HFF-1 cells were determined and the melatonin’s inactive ingredients were studied to ensure they had no effect as well. Pheochromocytoma-12 (PC-12) cells were exposed to the same conditions, and Nerve Growth Factor (NGF) to allow differentiation into mature neurons. Melatonin was found to increase axonal growth of PC-12 at certain concentrations.
Keywords: human foreskin fibroblasts, pheochromocytoma, sleep aids, melatonin, neuronal growth factor, axon, neurite
OTC, over-the-counter; NSA, nighttime sleep aid; HFF, human foreskin fibroblasts; PC, pheochromocytoma; ECM, extracellular matrix; NGF, nerve growth factor; PBS, phosphate buffer saline; SD, standard deviation; PU, proportional unit
Over forty-four percent of adults over the age of 65 reportedly use over-the-counter (OTC) sleep aids on a frequent basis to mitigate their sleep problems.1 Users rarely consult a physician or pharmacist about the safety and risks in these medications so they are often misused.2 The abuse of OTC sleep aids involves long-term use, inaccurate dosage, incorrect self-diagnosis, and consumption in conjunction with certain medications.3 OTC sleep aids typically contain antihistamines such as diphenhydramine hydrochloride which tends to have a sedating effect on users.4 It has a longer half-life in young people compared to the elderly, meaning older adults can experience residual effects from diphenhydramine-containing sleep aids the morning after.1 Other types of OTC sleep aids contain melatonin which is widely used as a herbal medicinal option to improve sleep quality.1 ,5 It is a hormone predominately secreted by the pineal gland and plays a central role in regulating mammalian circadian rhythms.5 However, melatonin has the ability to reduce fertility in rodent species so it may also have harmful effects in humans.5 In addition, few studies have explored the toxicity of melatonin at the cellular level since low doses have few phenotypic effects on the end-user.6
Human foreskin fibroblasts (HFF-1) cells and pheochromocytoma (PC-12) cells will be exposed to therapeutic levels of melatonin to determine effects at the cellular level.7 When exposed to different environments or conditions, cells tend to have variable morphology and activity.8 Fibroblasts are spindle-shaped cells responsible for preserving the structural integrity of connective tissue and function in the synthesis of extracellular matrix (ECM) proteins like collagen and fibronectin.8 These cells have the ability to interact with the cytoskeleton of the cell and surrounding ECM through the activity of integrin receptors embedded in the cell membrane.9 Integrins are heterodimers composed of 2 subunits, α and β, and enable adhesion and interaction between other cells and the ECM upon ligand binding.9 Introduction of histamine has been found to encourage cell adhesion during post-operative injury healing so antihistamine may have the opposite effect.6 Meanwhile, melatonin interference in fibroblast anion channel signaling pathways has been discovered to cause a decrease in cell proliferation in animal models.7
Melatonin also may have neuroregenerative and neuroprotective function and promote additional axonal growth at higher than normal concentration in neurons.10 Neuronal cells, in the presence of nerve growth factor (NGF),11 are differentiated into mature neurons, and this is observable by the restructuring of the cytoskeleton to build neurites and axonal outgrowth.12 This can be measured empirically by detecting a change in axonal length and width. As the site of action for melatonin in humans is at the raphe nuclei in the brain, melatonin will be tested on neuronal cells.13 While the body is at rest, energy can be allotted to growth, with melatonin likely playing a vital role in that activated pathway. The HFF-1 cells will act as a microcosm to a more complex organism, portraying action at the cellular level.13
HFF-1 and PC-12 cell culture
HFF-1 cells (ATCC, Manassas, VA, USA) and PC-12 cells (ATCC, Manassas, VA, USA) were prepared in T75 flasks (Thermo ScientificTM, Waltham, MA, USA) and stored in an incubator (Thermo ScientificTM, Waltham, MA, USA) at 37°C and 5% CO2. After confirmation of appropriate confluency via phase contrast microscope CKX41 (Olympus®️, Shinjuku, Tokyo, Japan), old media from the HFF-1 cells was aspirated off. Two washes were performed with the addition of 5 mL of phosphate buffer saline (PBS) (GE Healthcare, Chicago, IL, USA) and subsequently removed. Followed by the addition of 5 mL of 0.25% trypsin (GE Healthcare, Chicago, IL, USA), the cells were left to incubate at room temperature for about 5 minutes. To ensure detachment of cells from the flask, examination under the phase contrast microscope was performed. To stop trypsin activity, 5 mL of HFF-1 media was added to the flask. The total suspension of 10 mL was moved to a 15 mL conical centrifuge tube (Fisherbrand, Waltham, MA, USA). For PC-12 cells, the initial suspension found in the T75 flask was directly moved to a 15 mL conical centrifuge tube. The conical tubes were spun down in a centrifuge (Eppendorf AG, Hamburg, Germany) at 200 rpm for 5 minutes. The supernatant was then removed and the remaining pellet was resuspended in 1 mL of HFF-1 or PC-12 media. 20 μL of the resuspended solution was added to a Cellometer slide (Nexcelom Bioscience, Lawrence, MA, USA) and using the Cellometer Auto T4 (Nexcelom Bioscience, Lawrence, MA, USA) program, the average cell concentration was obtained.
2D HFF-1 cell proliferation assay
Collagen and Fibronectin
3x24-well plates (Corning Incorporated, Corning, NY, USA), were coated with collagen (Sigma-Aldrich®, St. Louis, MO, USA) and fibronectin (Sigma-Aldrich®️, St. Louis, MO, USA) at concentrations of 5µg/mL and 10µg/mL. 10,000 cells were seeded per appropriate well with HFF-1 media and incubated at 37°C, 5% CO2.
Sleep aids
ZzzQuilTM (Procter & Gamble, Cincinnati, OH, USA) was obtained from Walmart in Camarillo. Nighttime Sleep Aid (NSA) (Target Corporation, Minneapolis, MN, USA) was obtained from Target in Northridge, CA. Liquid Melatonin (Natrol®, Los Angeles, CA, USA) was obtained from Rite Aid in Port Hueneme and on Ebay. ZzzQuilTM is a name-brand product, while NSA is it’s generic counterpart. Liquid Melatonin contains 1 mg strength. Solubility of sleep aids were determined and pH (Micro Essential Laboratory, Brooklyn, NY, USA) were observed between 7 and 8 in a 1:1 ratio with HFF-1 media. HFF-1 media was treated with sleep aids at concentrations of 1% and 5%. 6x24-well plates were coated with collagen at 10µg/mL. 10,000 cells were seeded per appropriate well with HFF-1 media and sleep aid, and incubated at 37°C, 5% CO2.
Different concentrations of melatonin
Liquid Melatonin was vacuum filtered with Nalgene™ 25mm Syringe Filters (Thermo ScientificTM, Waltham, MA, USA). HFF-1 media was treated with Liquid Melatonin at concentrations of 0.5%, 1%, 5%, 10%, 20%, and 40%. 6x24-well plates were coated with collagen at 10µg/mL. 5,000 cells were seeded per appropriate well with HFF-1 media and melatonin, and incubated at 37°C, 5% CO2.
Inactive ingredients of melatonin
The inactive ingredients of Liquid Melatonin tested were citric acid (Product # 251275, Sigma-Aldrich®️, St. Louis, MO, USA), sucralose (Product # 69293, Sigma-Aldrich®️, St. Louis, MO, USA), and vanillin (Product # V1104, Sigma-Aldrich®️, St. Louis, MO, USA). After reconstitution, inactive ingredient stocks were vacuum filtered and further diluted with HFF-1 media for a final concentration of 5%. 3x24-well plates were coated with collagen at 10µg/mL. 5,000 cells were seeded per appropriate well with HFF-1 media and inactive ingredient, and incubated at 37°C, 5% CO2.
HFF-1 analysis
After appropriate incubation of 0 days (1hour), 3 days, or 7 days, three washes were performed with the addition of 0.5 mL of PBS per well and subsequently removed. A calcein solution consisting of a ratio of 10µL of calcein-AM (Life Technologies, Carlsbad, CA, USA) and 5mL of PBS was prepared in order to visualize the cells. 200µL of this calcein solution was then added into each well and stored in darkness for 15minutes. Cell proliferation was measured using a Filtermax F5 Microplate Reader (Molecular Devices, San Jose, CA, USA) and data was calculated on Microsoft Excel. Fluorescent images were taken on a fluorescent microscope 1X71 with a Cy3 filter (Olympus®️, Shinjuku, Tokyo, Japan) at a 10x magnification.
Cell culture of PC-12 cells
After confirmation of proper confluency of PC-12 cells maintained in a 75 mL flask via microscope, the old media was removed and transferred to a conical tube. The total suspension of 10 mL was centrifuged at 200 rpm for 5 minutes. The supernatant was removed and the remaining pellet was resuspended in 1 mL of PC-12 media. 20μL of cell mixture was added to the Nexelcom Cellometer Auto T4 and the average cell concentration was obtained.
2D PC-12 cell proliferation assay
Collagen and fibronectin
3x24-well plates, were coated with collagen and fibronectin at 10µg/mL. 50,000 cells were seeded per appropriate well with PC-12 media and incubated at 37°C, 5% CO2.After appropriate incubation, the plates were washed three times with PBS and then analyzed.
Nerve growth factor (NGF)
After reconstitution of NGF (Catalog#01-125, EMD Millipore Corporation, Temecula, CA, USA), PC-12 media was treated with NGF at concentrations of 200 ng/mL, 600 ng/mL, and 1000 ng/mL. A 24 well plate was coated with collagen at 10µg/mL. 10,000 cells were seeded per appropriate well with PC-12 media and NGF, and incubated at 37°C, 5% CO2.
NGF and various concentrations of melatonin
PC-12 media was treated with NGF at 600ng/mL and Natrol© Liquid Melatonin at concentrations of 0.5%, 1%, 5%, 10%, and 20%. 2x24-well plates were coated with collagen at 10µg/mL. 10,000 cells were seeded per appropriate well with PC-12 media, NGF, and melatonin, and incubated at 37°C, 5% CO2.
PC-12 analysis
After appropriate incubation of 0 days (1 hour), 4 days, or 7 days, brightfield images were taken on a fluorescent microscope 1X71 with a Cy3 filter at a 10x magnification. The same well plate was used for various time points. Axonal and dendritic proliferations were measured, with the greatest axonal thickness in every 10X image measured proportionally using a constant arbitrary unit, proportional units (PU). Data was calculated on Microsoft Excel.
Statistical analysis
Data is presented as mean±standard deviation (SD). A Paired Student t-Test was used to determine significance of observed differences between the study groups. A value of p<0.05 is considered statistically significant.
The effect of collagen and fibronectin on HFF-1 cells
The initial adhesion of HFF-1 cells on collagen or fibronectin at 5µg/mL or 10µg/mL at Day 0 were compared. Initial adhesion is expressed as a percentage of the initial number of cells present after a one hour attachment. The greatest initial adhesion was found when grown on fibronectin at 10µg/mL (100%) and least when grown on collagen at 10µg/mL (71%). This confirmed that cells were present at Day 0. Subsequently, cell proliferation is expressed as a percentage of the number of cells present at Day 0 (100%), Day 3, and Day 7. As shown in Figure 1A, the greatest cell proliferation of HFF-1 cells was found when grown on collagen 10µg/mL and least when grown on fibronectin 10µg/mL. As the concentration of collagen increases, cell proliferation increases as well. This is contrary to fibronectin, where as concentration increases, cell proliferation decreases significantly. On Day 0, the HFF-1 cells of all four conditions are present and are relatively rounded as shown in Figure 1B. By Day 3, some of the cells appear to be spreading out across the surface of the flask. However, rounded cells are also present among all four conditions. With the exception of collagen 5µg/mL, the various conditions exhibit significant growth. By Day 7, the cells are more confluent with sparse areas clearly present in fibronectin 5 and 10µg/mL. Similarly, while spreading of some cells is apparent, rounded cells are dominantly present among all the conditions.
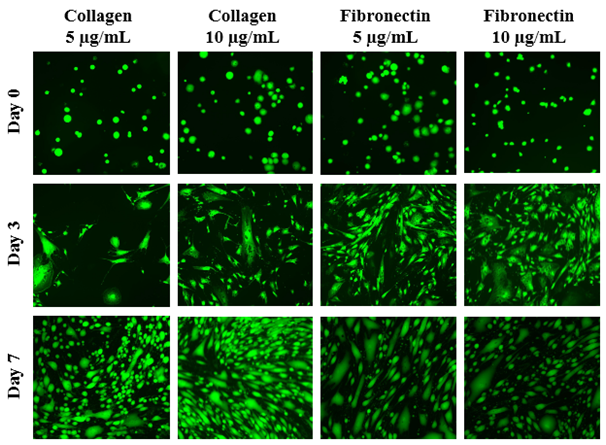
Figure 1B The Effect of Collagen and Fibronectin on Morphology of HFF-1 Cells.
Figure 1 The Effect of Collagen and Fibronectin on HFF-1 Cells (A) Growth of HFF-1 cells when seeded on collagen at 5 µg/mL, collagen at 10 µg/mL, fibronectin at 5 µg/mL, and fibronectin at 10 µg/mL were observed at Day 0, Day 3, and Day 7. HFF-1 cells were dyed with a calcein solution for viability. Cell proliferation percentage was calculated based on bottom fluorescence intensity data obtained from Filtermax F5 Microplate Reader. p < 0.05 were regarded as significant and are indicated with (*)(✝). P-values were determined by comparing the same ECM at different concentrations and the different ECM at the same concentration at Day 0, Day 3, and Day 7. (B) Representative images of cell proliferation obtained with Olympus®️ IX71 Microscope at a 10x magnification shows adhesion and cell growth. N=6.
The effect of sleep aids on HFF-1 cells
The initial adhesion of HFF-1 cells in ZzzQuil, NSA, or melatonin at 1% or 5% concentration at Day 0 were compared. The greatest initial adhesion was found when grown on ZzzQuil 5% (108%) and least when grown on melatonin 1% (49%), relative to a no treatment (100%) condition. Similar results were observed when HFF-1 cells were treated with ZzzQuil or NSA. Regardless of condition, cells treated at a higher concentration of 5% adhered better than when treated at a lower concentration of 1%. Furthermore, when treated with melatonin, HFF-1 cells do not adhere as effectively when treated with ZzzQuil and NSA. Overall, this confirmed that cells were present at Day 0. Subsequently, cell proliferation is expressed as a percentage of the number of cells present at Day 0 (100%), Day 3, and Day 7. As shown in Figure 2A, the greatest cell proliferation of HFF-1 cells was found when grown with melatonin and similar poor results when grown with ZzzQuil or NSA. No difference was found between the cell proliferation of HFF-1 cells when treated with ZzzQuil or NSA. When treated with ZzzQuil or NSA at 1%, HFF-1 cells were still proliferating at Day 3. However, when treated with ZzzQuil or NSA at 5%, the cells experienced minimal, if any, growth at Day 3 and by Day 7, even fewer cells were present. On the other hand, HFF-1 cells treated with melatonin at 1% or 5% exhibit significant proliferation in comparison to the other treatments, with 5% being slightly better. On Day 0, the HFF-1 cells of all four conditions are present, numerous, and are relatively rounded as shown in Figure 2B. By Day 3, the cells appear to have spread out across the surface of the flask. With the exception of ZzzQuil and NSA at 5%, the various conditions also appear to be confluent. By Day 7, the cells have spread further with no visible sparse areas.
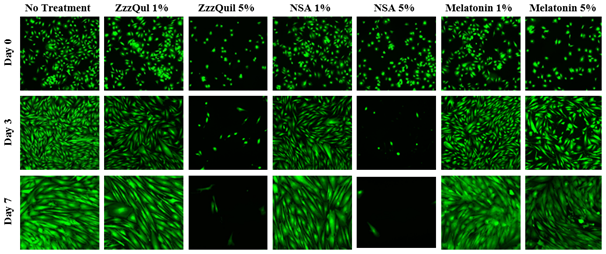
Figure 2B The Effect of Sleep Aids on Morphology of HFF-1 Cells.
Figure 2 The Effect of Sleep Aids on HFF-1 Cells (A) Growth of HFF-1 cells when treated with ZzzQuil, NSA, and Liquid Melatonin at concentrations of 1% and 5% were observed at Day 0, Day 3, and Day 7. HFF-1 cells were seeded on wells coated with collagen at 10 µg/mL and dyed with a calcein solution for viability. Cell proliferation percentage was calculated based on bottom fluorescence intensity data obtained from Filtermax F5 Microplate Reader. p < 0.05 were regarded as significant & are indicated with (* Day 0)(✝ Day 3)(♢ Day 7). P-values were determined by comparing treatment with sleep aid with no treatment at Day 0, Day 3, and Day 7. (B) Representative images of cell proliferation obtained with Olympus®️ IX71 Microscope at a 10x magnification shows adhesion and cell growth. No treatment N=6 and sleep aids N=3.
The effect of various concentrations of melatonin on HFF-1 Cells
The initial adhesion of HFF-1 cells in melatonin at 0%, 0.5%, 1%, 5%, 10%, 20%, and 40% concentration at Day 0 were compared. The greatest initial adhesion was found when grown on melatonin 5% (119%) and 10% (118%) and least when grown on melatonin 40% (17%), relative to a no treatment (100%) condition. A slight bell-shaped curve is evident with melatonin 5% and 10% at the peaks and decreasing initial adhesion on either side, more significant however, when treated with melatonin 20% or 40%. Overall, this confirmed that cells were present at Day 0. Subsequently, cell proliferation is expressed as a percentage of the number of cells present at Day 0 (100%), Day 3, and Day 7. As shown in Figure 3A, the greatest cell proliferation of HFF-1 cells was found when grown with melatonin 0.5%, followed closely by treatment of melatonin 1%, and least when grown with melatonin 40%. HFF-1 cells treated with melatonin at lower concentrations exhibited significant proliferation. However, when treated with melatonin 20% or 40%, the cells experienced minimal, if any, growth at Day 3 and by Day 7, even fewer cells were present. In addition, when treated with lower concentrations from 0.5% to 10% a dual effect is evident as a sudden lower proliferation rate was observed at melatonin 5%. On Day 0, the HFF-1 cells of all conditions are present and are relatively rounded as shown in Figure 3B. By Day 3, the cells appear to have spread out across the surface of the flask, with the exception of melatonin 40%, which appears to have remained rounded. Conditions at melatonin 10% and below appear to be confluent, with melatonin 20% exhibiting sparse areas. Furthermore, the cells in melatonin 20% are larger and more spread out compared to lower concentrations. By Day 7, the cells in conditions of melatonin 10% are more confluent, with no progress made at melatonin 20%, and no viable cells at melatonin 40%.
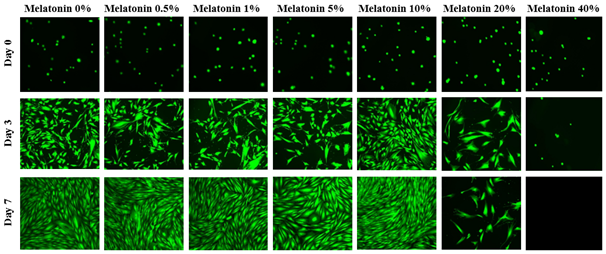
Figure 3B The Effect of Various Concentrations of Melatonin on Morphology of HFF-1 Cells.
Figure 3 The Effect of Various Concentrations of Melatonin on HFF-1 Cells (A) Growth of HFF-1 cells when treated with Liquid Melatonin at concentrations of 0.5%, 1%, 5%, 10%, 20%, and 40% were observed at Day 0, Day 3, and Day 7. HFF-1 cells were seeded on wells coated with collagen at 10 µg/mL and dyed with a calcein solution for viability. Cell proliferation percentage was calculated based on bottom fluorescence intensity data obtained from Filtermax F5 Microplate Reader. p < 0.05 were regarded as significant and are indicated with (* Day 0)(✝ Day 3)(♢ Day 7). P-values were determined by comparing treatment with different concentrations of melatonin with no treatment (0%) at Day 0, Day 3, and Day 7. (B) Representative images of cell proliferation obtained with Olympus®️ IX71 Microscope at a 10x magnification shows adhesion and cell growth. No treatment N=18 and melatonin N=9.
The effect of the inactive ingredients of melatonin on HFF-1 cells
The initial adhesion of HFF-1 cells in citric acid, vanillin, and sucralose at 5% concentration at Day 0 were compared. The greatest initial adhesion was found when grown on vanillin (79%) and least when grown on sucralose (61%), relative to a no treatment (100%) condition. Overall, this confirmed that cells were present at Day 0. Subsequently, cell proliferation is expressed as a percentage of the number of cells present at Day 0 (100%), Day 3, and Day 7. As shown in Figure 4A, the greatest cell proliferation of HFF-1 cells was found when grown with sucralose, followed closely by treatment with citric acid, and least when grown with vanillin. When individually treated with the inactive ingredients of Liquid Melatonin, a slight increase in cell proliferation over non treated HFF-1 cells is apparent. On Day 0, the HFF-1 cells of all four conditions are present and are relatively rounded as shown in Figure 4B. By Day 3, the cells across all conditions appear to have spread out across the surface of the flask and are confluent. By Day 7, the cells are more confluent.
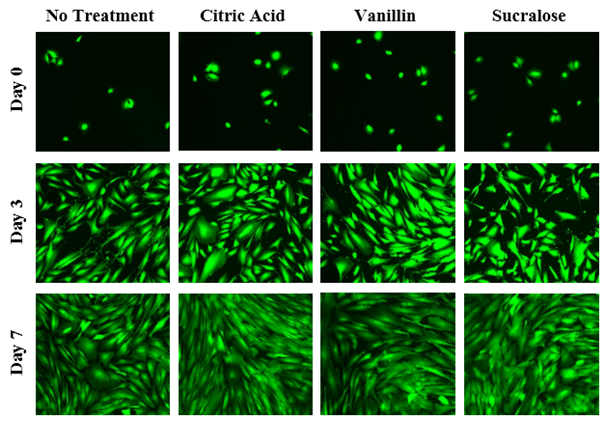
Figure 4B The Effect of Inactive Ingredients of Melatonin on Morphology of HFF-1 Cells.
Figure 4 The Effect of Inactive Ingredients of Melatonin on HFF-1 Cells (A) Growth of HFF-1 cells when treated with inactive ingredients of Liquid Melatonin at a concentration 5% were observed at Day 0, Day 3, and Day 7. HFF-1 cells were seeded on wells coated with collagen at 10 µg/mL and dyed with a calcein solution for viability. Cell proliferation percentage was calculated based on bottom fluorescence intensity data obtained from Filtermax F5 Microplate Reader. p < 0.05 were regarded as significant & are indicated with (✝). P-values were determined by comparing treatment with inactive ingredients of melatonin with no treatment at Day 0, Day 3, and Day 7. (B) Representative images of cell proliferation obtained with Olympus®️ IX71 Microscope at a 10x magnification shows adhesion and cell growth. N=9.
The effect of collagen and fibronectin on PC-12 cells
The initial adhesion of PC-12 cells on collagen or fibronectin at 10µg/mL at Day 4 was compared. The greatest initial adhesion was found when grown on collagen at 10µg/mL (100%) and least when grown on fibronectin at 10µg/mL (32%). This confirmed that cells were present at Day 4. Subsequently, cell proliferation is expressed as a percentage of the number of cells present at Day 4 (100%) and Day 7. As shown in Figure 5A, the greatest cell proliferation of PC-12 cells was found when grown on collagen 10µg/mL and least when grown on fibronectin 10µg/mL. Poor, if any, proliferation was found when PC-12 cells were seeded on fibronectin. On Day 4, the PC-12 cells of all four conditions are present, clumped, and are relatively rounded as shown in Figure 5B. Several layers, unfocused cells at a distance, focused cells, and unfocused cells up close, are evident. By Day 7, the cells grown on collagen 10µg/mL are more confluent with sparse areas present. On the other hand, PC-12 cells grown on fibronectin 10µg/mL are not as numerous.
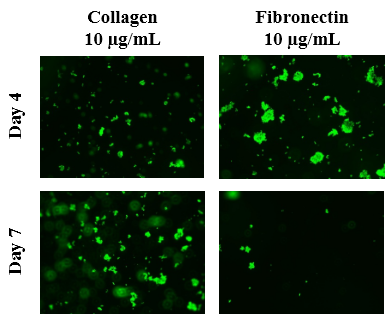
Figure 5B The Effect of Collagen and Fibronectin on Morphology of PC-12 Cells.
Figure 5 The Effect of Collagen and Fibronectin on PC-12 Cells (A) Growth of PC-12 cells when seeded on collagen at 10 µg/mL and fibronectin at 10 µg/mL were observed at Day 4 and Day 7. PC-12 cells were dyed with a calcein solution to examine cell viability. Cell proliferation percentage was calculated based on bottom fluorescence intensity data obtained from Filtermax F5 Microplate Reader. p < 0.05 were regarded as significant and are indicated with (*). P-values were determined by comparing the different ECM at the same concentration at Day 4 and Day 7. (B) Representative images of cell proliferation obtained with Olympus®️ IX71 Microscope at a 10x magnification shows loose adhesion and cell growth. N=6.
The effect of NGF on PC-12 cells
Optimal amounts of NGF on PC-12 cells affecting axonal length are expressed in PU present on Day 0, Day 4, and Day 7. Differences in axon length of the different conditions of NGF concentrations are depicted in Figure 6A. With the longest and largest axons in each condition measured, as concentrations of NGF increase, length of the protruding neurites increase as well. On Day 0, the PC-12 cells of all conditions are present and are relatively rounded as shown in Figure 6B. By Day 4, the cells are no longer rounded but do not necessarily appear to be spread out across the surface of the flask. Instead, the cells appear disfigured and in those conditions treated with NGF, axons have emerged from the cells themselves. Higher concentrations of NGF displayed longer and wider neurites relative to the cells treated with NGF at lower concentrations. By Day 7, more pronounced axons are observed with treatment of higher concentrations experiencing more outgrowth. Treatment with 600ng/mL of NGF amount is sufficient to see axonal outgrowth in the presence of an additional variable.
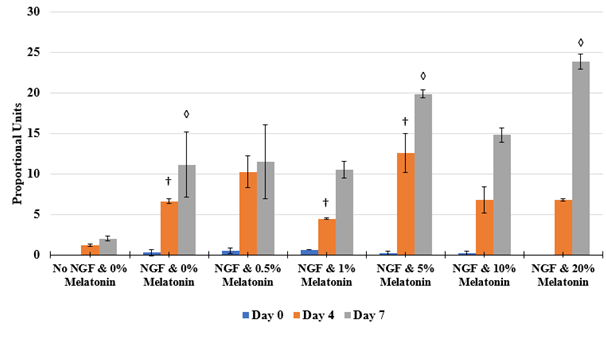
Figure 6B The Effect of NGF on Morphology of PC-12 Cells.
Figure 6 The Effect of NGF on PC-12 Cells (A) Length of axons measured in PU calculated at Day 0, Day 4, and Day 7. p < 0.05 were regarded as significant and are indicated with (* Day 0)(✝ Day 4)(♢ Day 7). P-values were determined by comparing treatment with different concentrations of NGF with no treatment (0 ng/mL) at Day 0, Day 4, and Day 7. (B) Growth of PC-12 cells when treated with NGF at concentrations of 200 ng/mL, 600 ng/mL, and 1000 ng/mL. PC-12 cells were seeded on wells coated with collagen at 10 µg/mL. Representative images of cell proliferation obtained with Olympus®️ IX71 Microscope at a 10x magnification shows axonal neurite growth. N=3.
The effect of NGF and various concentrations of melatonin on PC-12 cells
Treatment with NGF and various concentrations of melatonin of PC-12 cells affecting axonal length are expressed in PU present on Day 0, Day 4, and Day 7 and are depicted in Figure 7A. At Day 0, growth axonal length were not measurable. However, on Day 4 and Day 7, neurite outgrowth from PC-12 cells were observed in all conditions with the exception of no treatment with no NGF. Higher concentrations of NGF displayed longer and wider neurites relative to the cells treated with NGF at lower concentrations. A slight double bell-shaped curve is evident with melatonin 0.5%, 5%, and 20% at the peaks and decreasing outgrowth on either side. On Day 0, the PC-12 cells of all conditions are present and are relatively rounded as shown in Figure 7B. By Day 4, the cells are no longer rounded but do not necessarily appear to be spread out across the surface of the flask. Instead, the cells appear disfigured and in those conditions treated with NGF, axons have emerged from the cells themselves. However, rounded cells are still present among the conditions. By Day 7, more pronounced axons are present regardless of treatment with melatonin as shown in Figures 7(C & D).
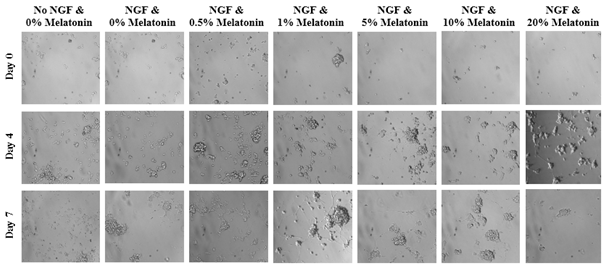
Figure 7A The Effect of NGF and Various Concentrations of Melatonin on Longest Axonal Length of PC-12 Cells.
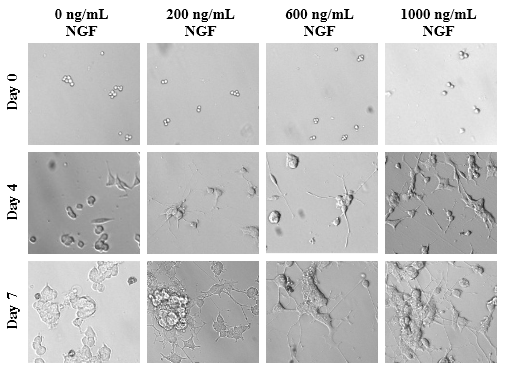
Figure 7D Calcein Fluorescence and Grayscale Conversion PC-12 Morphology Exposed to NGF and Melatonin.
Figure 7 The Effect of NGF and Various Concentrations of Melatonin on PC-12 Cells (A) Length of axons measured in PU were calculated at Day 0, Day 4, and Day 7. p < 0.05 were regarded as significant and are indicated with (* Day 0)(✝ Day 4)(♢ Day 7). P-values were determined by comparing treatment with NGF and different concentrations of melatonin with NGF and no treatment (0%) at Day 0, Day 4, and Day 7. NGF and no treatment was compared with no NGF and no treatment. (B) Growth of PC-12 cells when treated with NGF at a concentration of 600 ng/mL and Liquid Melatonin at concentrations of 0.5%, 1%, 5%, 10%, and 20% were observed at Day 0, Day 4, and Day 7. PC-12 cells were seeded on wells coated with collagen at 10 µg/mL. Representative images of cell proliferation obtained with Olympus®️ IX71 Microscope at a 10x magnification shows axonal neurite growth. (C) Using a consistent transparent ruler with all imagery accessed at a set resolution, the greatest axon width and length observed in each condition’s image was recorded and compared to all other conditions. Shown condition is NGF and 1% Melatonin on Day 7. (D) Visualization of PC-12 cells exposed to NGF and melatonin using calcein fluorescence and green tint. Image color inverted to white and magenta for higher resolution of axon growth. N=3.
This study was performed to determine the effect of sleep aids on HFF-1 cells and PC-12 cells since sleep aid has been shown to have adverse effects in humans.1 Fibroblasts utilize integrins to interact with ECM substrates such as collagen.14 There is a subgroup of integrins on the surface of fibroblasts which have an affinity for GFOGER sequences in collagen.14 In order for the cells to bind to fibronectin, the substrate must be layered on a rigid surface and undergo a conformational change so the matrices where the cell can bind are exposed.14 Meanwhile, the cells are able to bind to collagen more easily since the cell binding site in collagen is accessible with no collagen alteration required.14 The fibroblasts proliferated significantly better on higher concentrations of collagen compared to fibronectin likely due to ease of integrin binding to collagen which was an expected outcome (Figure 1). For subsequent experiments, collagen was used to coat plates because of this observation. The cells appeared rounded like bubbles after one week. This potentially occurred because of a phenomenon called “bubbling cell death” in which a bubble swells from the nucleus eventually causing cell death.15 It occurs when the cells are under stress such as exposure to extreme temperature or UV rays.15 The cells may have been incubated in calcein for an extended period of time and begun to undergo this process of cell death. Cell proliferation assays demonstrated no difference in cell growth between ZzzQuil-treatment and NSA-treatment. On Day 3, the 1% sleep aid-treated cells had higher cell proliferation than the Day 7 cells. The cells appear moderately stretched and narrow with sharp ends ends on Day 7 compared to Day 3. This variation in morphology is a characterization of confluency.16 For instance, gland epithelial cells are elongated and skinny in appearance compared to conventional cells when they reach confluency.16 Many cells that were viable Day 3 may have undergone apoptosis by Day 7 due to lack of sufficient nutrients and space to grow. Sleep aids containing diphenhydramine HCl appear to have an antiproliferative effect on fibroblast cells at 5% while melatonin sleep aid at the same concentration seems to increase proliferation of cells.17 A 30 mL dose of sleep aid containing diphenhydramine HCl contains 50 mg while the melatonin content in the melatonin sleep aid is lower so the cells were treated with higher concentrations of diphenhydramine HCl than melatonin. The human body may be able to metabolize diphenhydramine HCl while fibroblast cells alone in an assay are more susceptible to harmful effects.17 Other studies examining diphenhydramine effect on fibroblast utilized much smaller concentrations using 1µg/mL of the active component.17
After testing a wide range of melatonin concentrations from 0% to 40%, it was found the fibroblasts were able to proliferate in melatonin concentrations up to 10%. Treatment with 40% melatonin concentration resulted in no cell growth and there were no viable cells observed via microscopy by Day 7. The 20% concentration of melatonin made cells appear larger on Day 3 likely because the fibroblasts were undergoing senescence.18,19 Once more, the cell proliferation appears to decrease on Day 7. Since this was predicted to be due to the cells reaching confluency by Day 3, a lower number of cells were seeded in consequent experiments. Flavoring used in the melatonin sleep aid had a slight impact on cell proliferation but this was generally not significant. Sucralose is an artificial sweetener which has been shown to impact microbes in the gut microbiome leading to increased inflammation, however, little research has been done on its effect on the body on a cellular level.20 Our findings indicate the cells had statistically significant increased proliferation on Day 3 in the sucralose condition (Figure 4). The morphology of the cells appeared identical in all conditions which indicates the inactive ingredients tested do not explain the effect of the sleep aid melatonin. However, HFF-1 cell proliferation should also be tested in higher concentrations of the inactive ingredients to verify there is little effect on the cell growth.
PC-12 cells are semi-adherent which entails that, unlike HFF-1 cells, they will clump together during growth, and only a small percentage will ever bind to an extracellular matrix through integrins.21 This concept may explain why the PC-12 cells did not adhere to the plate until Day 4. Due to this restriction, the cells were centrifuged with media and trypsin in order to gather a pellet of cells and then PBS was used to wash the cells. Because of this processing methodology, some cells may have also been washed away and our results are not as accurate. In determining which extracellular matrix would be ideal for the proliferation of PC-12 cells, the well plates were coated with collagen and fibronectin at 10µg/mL prior to seeding of PC-12 cells. A collagen extracellular matrix allowed for the highest proliferation of PC-12 cells. With this finding, subsequent experiments were performed with well plates treated with 10µg/mL of collagen. Previous experiments with PC-12 used 10,000 cells per well which caused plate reader analysis to be ineffective due to the nature of PC-12 cells to clump. Therefore, 50,000 cells per well were used for this experiment to yield clearer morphology results.
Nevertheless, PC-12 cells are an established cell line for neurochemical experiments, due to their secretory nature as adrenal cells.21 When PC-12 cells are in the presence of NGF, they differentiate into neuron-like cells with corresponding neural structures, a process known as neuritogenesis.22 Specific NGF concentrations were selected due to historical PC-12 experiments, with a high end of NGF saturation for PC-12 and a low end of NGF for minimal effect to yield neurite growth.23 NGF concentrations of 200ng/mL, 600ng/mL, and 1000 ng/mL were applied to PC-12 cells. These amounts were selected based on 133ng/mL NGF being the minimum amount required to provide guidance to PC-12 axons while 955ng/mL is the maximum saturation level for that cell type.23 A positive effect on the PC-12 cell proliferation was observed when treated with NGF, evidenced by increased axonal growth when compared to untreated cells. With an increase of NGF concentration, the length of the axons increased, since NGF is required for differentiation and growth.23 As a result of our NGF length experiments, subsequent experiments were performed with PC-12 cells treated with 600 ng/mL of NGF, as this was deemed sufficient to yield differentiation and neuritogenesis. Coincident with NGF, PC-12 cells were treated with various concentrations of Natrol® Melatonin drops, ranging from 0.5% to 20%. PC-12 cells treated with 1% or 5% melatonin and NGF portrayed cells with more axonal growth than the other conditions tested. This corresponds to the results of HFF-1 cells with melatonin since the 5% concentration resulted in higher HFF-1 cell proliferation. PC-12 cells were first used to observe enodgenous acetylcholine and norepinephrine secretory pathways, and melatonin may be uptaken by vesicles in a similar way, yielding the effects observed.21 PC-12 cells were later studied under exposure to melatonin where proliferation increased compared to the control, and differentiation into neuronal-like cells was observed without the presence of NGF. It is thought that the melatonin receptors are starting a g-protein coupled cascade involving the MEK/ERK and PI3K/AKT pathways for proliferation. Differentiation into a neuron-like cell is likely only occurring through the MEK/ERK pathway.24 At the concentrations of melatonin used in our experiments, differentiation was not observed without the presence of NGF.
This study was used to determine if sleep aid containing melatonin, a naturally occurring hormone, had an effect on HFF-1 and PC-12 cells at the cellular level when administered at a concentrated therapeutic amount. Patients administering clinical melatonin should be informed on the effect it has on their body and this experiment offers an unprecedented insight. At some concentrations, the Natrol® Liquid Melatonin significantly encouraged the proliferation of HFF-1 cells and the axonal growth of PC-12 cells. Future studies will include testing of isolated melatonin on either HFF-1 or PC-12 cells. It was confirmed, however, that the inactive ingredients of Natrol® Liquid Melatonin did not have a significant effect on initial adhesion, proliferation, nor axonal outgrowth. Furthermore, sucralose and citric acid also caused variable proliferation compared to the control but this difference was not determined to be statistically significant. To determine these effects, further study is required with higher percentages of these two ingredients. In addition, it is imperative to use higher concentrations of melatonin without NGF to yield differentiation effects as noted in previous studies.
None.
The author declares there are no conflicts of interest.

©2019 Krisha, et al. This is an open access article distributed under the terms of the, which permits unrestricted use, distribution, and build upon your work non-commercially.