Journal of
eISSN: 2572-8466


Research Article Volume 6 Issue 5
1Bio resources Conservation Institute, National Agriculture Research Centre, Pakistan
2Social Sciences Research Institute, National Agriculture Research Centre, Pakistan
3Crop Sciences Institute, National Agriculture Research Centre, Pakistan
Correspondence: , Social Science Research Institute, NARC, Islamabad, Pakistan
Received: September 05, 2019 | Published: October 2, 2019
Citation: Raza I, Masood MA, Abid S, et al. Study of genetic diversity in rapeseed and mustard germplasm by using cluster analysis. J Appl Biotechnol Bioeng. 2019;6(5):236-239. DOI: 10.15406/jabb.2019.06.00199
The present study focuses on examining the genetic diversity in 104 accessions of rapeseed and mustard germplasm gathered from different regions of Pakistan. Correlation studies revealed positive correlation of yield component with morphological characters at 5% and 1% level of significance Cluster analysis divided the accessions into five major clusters I, II, III, IV and V. These diverse the germplasm are appropriate for planning of hybridization of programs.
Keywords: cluster, germplasm, accessions, diversity
Rapeseed (Brassica rapa and Brassica napus) and mustard (Brassica juncea), including the canola varieties, are among the most important oilseed crops in Pakistan. During 2010-2011, rapeseed and mustard were grown over an area of 203100 hectares in Pakistan out of which 17200 hectares were under canola varieties. Production of rapeseed and mustard was 176400 tons with 18600 tons of canola.1 During the year 2011-12, the total availability of edible oil in Pakistan was 2.748 million tonnes. Local production of edible oil was 0.636 million tonnes while 2.148 million tonnes were imported.2 In order to increase the production of edible oil in Pakistan, efforts are required to increase the production of oilseed crops including rapeseed and mustard. Introduction of canola varieties resulted in significant improvement of quality and production of rapeseed and mustard. However, in addition to the oil quality and seed characters, the genetic improvement for other economically important characters is also important. Study of genetic diversity in rapeseed and mustard germplasm is important for the selection of suitable genotypes for breeding programs.3–6 The present study was conducted to study the genetic diversity in germplasm resources of rapeseed and mustard from Pakistan for agro-morphological characters and selection of suitable material to be utilized in crop improvement.
A total of 104 accessions of rapeseed and mustard germplasm, including the landraces and cultivars, collected from different regions of Pakistan were used in the study. The experiment as conducted at Plant Genetic Resources Institute, National Agricultural Research Center, Islamabad. Germplasm accessions along with check variety Khanpur Raya were sown in the field during winter 2012-2013 using augmented design. Data were recorded for agro-morphological characters including days to 50 percent flowering, days to 100 percent flowering and days to maturity; qualitative morphological characters including leaf margin, leaf color, branching, mature leaf dissection, flower color, corolla shape, pedicel length and angle, leaf shape and stem shape; quantitative morphological characters including plant height, number of branches per plant, silique per raceme, raceme length, stem diameter, leaves per plant, pedicel length, leaf length, leaf width, silique width, silique length, seeds per silique and 100 grain weight. Ten plants of each accession were selected for data recording of qualitative and quantitative morphological characters and average was calculated for data analysis. Data for flowering and maturity was recorded from overall population of each accession.
Qualitative morphological characters were assessed through frequency distribution while in case of quantitative agro-morphological characters, frequency distribution, descriptive statistics correlation analysis and cluster analysis of germplasm were performed for all the characters using the software MINITAB 16.
Frequency distribution for nine qualitative morphological characters in germplasm accessions (Table 1) showed a variation for all the characters except leaf color.
Characters |
Categories |
Accessions |
Branching |
Basal |
11 |
Normal |
94 |
|
Stem shape |
Irregular |
35 |
Round |
70 |
|
Leaf color |
Green |
105 |
Leaf margins |
No serration |
1 |
Crenate |
22 |
|
Dentate |
48 |
|
Doubly dentate |
34 |
|
Leaf shape |
Elliptic |
74 |
Orbicular |
1 |
|
Ovate |
28 |
|
Pandurate |
2 |
|
Mature leaf dissection |
Lyrate |
95 |
Parted |
10 |
|
Pedicel length and angle |
Typical pedicel length and angle |
94 |
Short and very close to stem |
11 |
|
Flower color |
Light yellow |
10 |
Yellow |
94 |
|
White |
1 |
|
Corolla shape |
Thin elliptical |
34 |
Elliptical |
66 |
|
|
Round |
5 |
Table 1 Frequency distribution for qualitative morphological characters in 104 germplasm accessions and check variety of rapeseed and mustard
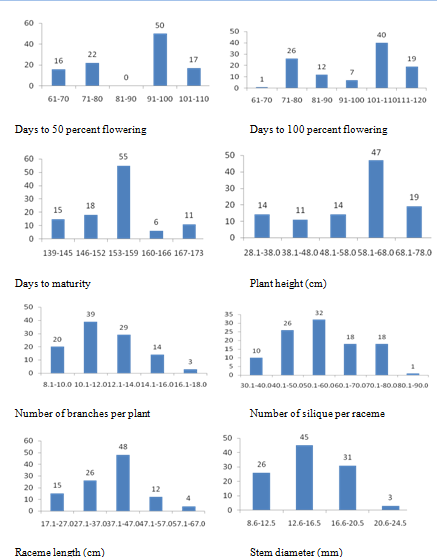
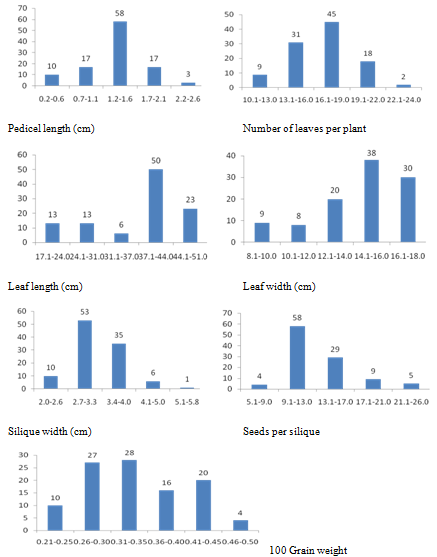
Frequency distribution for three physiological and twelve quantitative agro-morphological characters shows variation for all the characters studied (Figure 1). Descriptive statistics indicate that the variation is significant for all the characters (Table 2). Selection of suitable accessions for each character was made as shown in Table 3. The superior lines can be studied in detail for the development of short duration high yielding cultivars.

Figure 1a Frequency distrubution for quantitative agro-morphological characters in 104 germplasm accessions and check variety of rapeseed and mustard.

Figure 1b Frequency distrubution for quantitative agro-morphological characters in 104 germplasm accessions and check variety of rapeseed and mustard.
|
Mean |
Standard Error |
Sample Variance |
Minimum |
Maximum |
Days to 50 percent flowering |
89.848 |
1.407 |
207.765 |
62 |
108 |
Days to 100 percent flowering |
95.457 |
1.499 |
235.789 |
66 |
114 |
Days to maturity |
153.695 |
0.836 |
73.31 |
139 |
174 |
Plant Height |
57.392 |
1.193 |
149.329 |
29.8 |
78 |
Number of branches per plant |
12.018 |
0.188 |
3.726 |
8.6 |
17.6 |
Number of silique per raceme |
55.73 |
1.2 |
151.298 |
30.5 |
81 |
Raceme length |
38.166 |
0.92 |
88.813 |
17 |
66.4 |
Stem diameter |
14.883 |
0.3 |
9.447 |
8.618 |
22.47 |
Number of leaves per plant |
16.812 |
0.257 |
6.94 |
10.2 |
23 |
Pedical length |
1.332 |
0.041 |
0.18 |
0.32 |
2.44 |
Leaf length |
37.162 |
0.852 |
76.133 |
17.4 |
48.6 |
Leaf width |
14.432 |
0.238 |
5.955 |
8.1 |
17.86 |
Silique width |
3.287 |
0.054 |
0.307 |
1.958 |
5.7532 |
Silique length |
4.155 |
0.077 |
0.626 |
2.0336 |
5.984 |
Seeds per silique |
13.472 |
0.35 |
12.865 |
7.36 |
25.68 |
100 Grain weight |
0.338 |
0.007 |
0.005 |
0.2262 |
0.4736 |
Table 2 Descriptive statistics for quantitative agro-morphological characters in 104 germplasm accessions and check variety of rapeseed and mustard
Characters |
Accessions |
Day to 50 percent flowering |
1389, 928, 1319, 1450, 1472 |
Day to 100 percent flowering |
1389, 928, 1319, 1450, 1472 |
Days to maturity |
1480, 1481, 1482, 1489, 1497 |
Plant Height |
24931, 1493, 24921, 24928, 24924 |
Number of branches per plant |
1321, 24943, 1387 |
Number of silique per raceme |
24724, 24720, 24725, 24712, 24713 |
Raceme length |
26827, 24944, 1494, 1495 |
Stem diameter |
1648, 26827, 24943 |
Number of leaves per plant |
1387, 24708, 24719 |
Pedicel Length |
1495, 1493, 1472 |
Leaf length |
24705, 24706, 24711, 24921, 24707 |
Leaf width |
1474, 24921, 1477, 24956, 24718 |
Silique width |
1480 1478 1459 1464 1489 1473 1468 |
Seeds per silique |
1449, 931, 1496, 1454, 1455 |
100 Grain weight |
24921, 1498, 24712, 24726 |
Table 3 Selection of superior lines for agro-morphological characters in 104 germplasm accessions of rapeseed and mustard
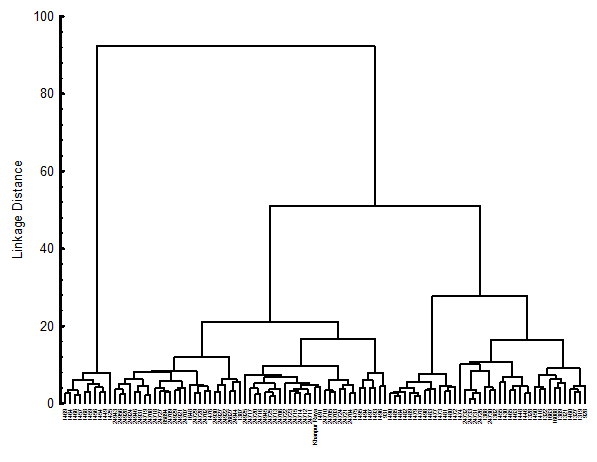
Correlation studies indicate the association of yield components with physiological and morphological characters (Table 4). Characters having positive correlation with yield components may help for the selection of promising lines (Figure 2).
|
Days to 50 percent flowering |
Days to 100 percent flowering |
Days to maturity |
Raceme length |
Stem diameter |
Number of leaves per plant |
Pedicel length |
Leaf length |
Leaf width |
Silique width |
Silique length |
Seeds per silique |
Days to 50 percent flowering |
1 |
**0.969 |
*0.215 |
**0.387 |
**0.395 |
'0.164 |
'-0.036 |
**0.255 |
'0.187 |
**-0.351 |
'-0.003 |
'-0.163 |
Days to 100 percent flowering |
**0.969 |
1 |
*0.241 |
**0.367 |
**0.367 |
'0.167 |
'-0.064 |
**0.258 |
*0.210 |
**-0.356 |
'0.031 |
'-0.167 |
Days to maturity |
*0.215 |
*0.241 |
1 |
**-0.358 |
'-0.003 |
'0.031 |
**-0.566 |
**-0.402 |
**-0.352 |
'-0.008 |
**-0.481 |
'0.176 |
Raceme length |
**0.387 |
**0.367 |
**-0.358 |
1 |
**0.607 |
**0.265 |
**0.421 |
**0.502 |
**0.336 |
**-0.309 |
**0.412 |
**-0.291 |
Stem diameter |
**0.395 |
**0.367 |
'-0.003 |
**0.607 |
1 |
**0.408 |
'0.149 |
**0.342 |
*0.214 |
**-0.317 |
'0.130 |
**-0.307 |
Number of leaves per plant |
'0.164 |
'0.167 |
'0.031 |
**0.265 |
**0.408 |
1 |
'0.022 |
**0.307 |
*0.215 |
'-0.085 |
'0.012 |
'-0.090 |
Pedicel length |
'-0.036 |
'-0.064 |
**-0.566 |
**0.421 |
'0.149 |
'0.022 |
1 |
**0.603 |
**0.472 |
'-0.097 |
**0.628 |
**-0.415 |
Leaf length |
**0.255 |
**0.258 |
**-0.402 |
**0.502 |
**0.342 |
**0.307 |
**0.603 |
1 |
**0.821 |
*-0.197 |
**0.576 |
**-0.469 |
Leaf width |
'0.187 |
*0.210 |
**-0.352 |
**0.336 |
*0.214 |
*0.215 |
**0.472 |
**0.821 |
1 |
'-0.178 |
**0.470 |
**-0.406 |
Silique width |
**-0.351 |
**-0.356 |
'-0.008 |
**-0.309 |
**-0.317 |
'-0.085 |
'-0.097 |
*-0.197 |
'-0.178 |
1 |
'-0.043 |
** 0.406 |
Silique length |
'-0.003 |
'0.031 |
**-0.481 |
**0.412 |
'0.130 |
'0.012 |
**0.628 |
**0.576 |
**0.470 |
'-0.043 |
1 |
**-0.268 |
Seeds per silique |
'-0.163 |
'-0.167 |
'0.176 |
**-0.291 |
**-0.307 |
'-0.090 |
**-0.415 |
**-0.469 |
**-0.406 |
**0.406 |
**-0.268 |
1 |
100 Grain weight |
'0.194 |
'0.173 |
'-0.155 |
'0.124 |
'0.029 |
'0.036 |
'0.144 |
**0.300 |
**0.297 |
'0.110 |
'0.123 |
'-0.072 |
Table 4 Correlation analysis of agro-morphological characters in 104 germplasm accessions and check variety of rapeseed and mustard
(*), 5 percent level of significance; (**), 1 percent level of significance.

Figure 2 Cluster analysis using wards method in 104 germplasm accessions and check variety of rapeseed and mustard.
Cluster analysis of germplasm on the basis of all the characters studied divided the germplasm into five major clusters at linkage distance of 20. The diverse germplasm accessions are suitable for the planning of hybridization programs. The dendrogram classified 104 accessions into 5 clusters based on the similarity of morphological characters within the clusters. A number of authors have made use of the cluster analysis technique for the determination of genetic similarity. The construction of dendrograms makes it possible to further visualize and interpret the findings of other studies.7–10
None.
The author declares there are no conflicts of interest.
None.

©2019 Raza, et al. This is an open access article distributed under the terms of the, which permits unrestricted use, distribution, and build upon your work non-commercially.