Journal of
eISSN: 2572-8466


Research Article Volume 7 Issue 1
1Federal State Budget Institution “Saint-Petersburg Scientific-Research Institute for Physical Culture”, Russia
1Federal State Budget Institution “Saint-Petersburg ScientificResearch Institute for Physical Culture”, Russia
Correspondence: Konstantin G Korotkov, Federal State Budget Institution “Saint-Petersburg Scientific-Research Institute for Physical Culture”, St. Petersburg, Ligovski 65, Russia
Received: December 23, 2019 | Published: January 16, 2020
Citation: Korotkov KG. Remote detection of music influence with physical sensor. J Appl Biotechnol Bioeng 2020;7(1):7-10. DOI: 10.15406/jabb.2020.07.00209
Goals and objectives of the study: The goal of this paper was to study the possibility of remote detection of electronic music influence with a physical sensor.
Study design: Bio-Well technology with a special environmental sensor was used in the study. This sensor was developed for the analysis of the electromagnetic fields and was shown to respond to the changed in the environmental parameters. Signal of a sensor was detected for an hour in the background mode after this music was turned on for 20 minutes, and then after-effect was detected for about one hour. In experiment 5 different files of the modern electronic music “Yippi Wave 3.0” (https://yippiweb.com/what-is-wave) in *wav format and several files of Handel music have been used.
Results: The statistically significant changes of sensor parameters to “Yippi Wave 3.0” music were detected in several time-series, while no response to Handel music.
Conclusions: This study should be considered a pilot study and the results are preliminary. We need to conduct experiments with different sources of both acoustic and electromagnetic signals and the possibility of their registration by the Bio-Well device.
Keywords: music therapy, psychophysiology, electrophotonic imaging, bio-well
CCD, charge-coupled device; GDV, gas discharge visualization; EPI, electrophotonic imaging
As shown in the review,1 the number of studies of emotional response to music increases in the last decades. Many of those researches suggest that individual differences in empathy, alexithymia, personality traits, and musical expertise might play a role in music-perceived emotions.2,3 Music Therapy became popular as a part of integrative medicine protocol.1 A large number of studies show the positive effect of music therapy on patients,4,5 but the cause of this effect remains unclear. It is not clear whether this effect is the result of a person's psycho-emotional reaction alone, or whether it is related to the direct influence of the frequency range of music on the physical level. Some authors proposed ideas that music may have a direct influence on the environment,1 but this topic, being intuitively clear for all musicians, is not properly studied with scientific approach. The goal of this paper was to study the possibility of remote detection of music influence with a physical sensor.
The background of this research was the results of using Bio-Well technology with the Environment Sensor in the study of the effect of different factors on the environment.6 The technique of Electrophotonic Imaging (EPI) allows the recording of electron and photon emission stimulated by an electromagnetic field in any subject, as well as the acquisition of these data by computer image processing. The short electric impulse (10 microsec) on the camera plate stimulates subjects and generates a response in the form of an excited gas plasma (that is why in physical terms this approach is known as Gas Discharge Visualization – GDV).7–9 This plasma emits light which is directly measured by a charge-coupled device (CCD), the state of the art in measuring low-level light that is used in astrophysics and other scientific endeavors. The CCD registers the pattern of photons detected over time. These digital data are transmitted directly into a computer for data processing, and each image from the light emitted is stored as a graphics file. These two-dimensional images of the light are then used to calculate the area, emission intensity, fracticality, and other parameters. The EPI technique has been found to be effective in evaluating the state of individual human health,10–13 and in the monitoring of individual reactions to different kinds of training.14–16
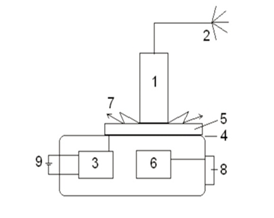
The Bio-Well device (www.Bio-Well.com) with a specially designed Environment Sensor is being used to monitor its response to the changes of environmental parameters.17 The physical principle is based on measuring the electrical capacitance of an environment by using two connected resonance contours. Schematic representation of the experimental setup is shown in Figure 1.

Figure 1 The experimental setup. 1 - metal cylinder; 2 Antenna "Sputnik"; 3 - high-voltage pulse generator; 4 - transparent conductive coating; 5 - transparent quartz electrode; 6 - video converter; 7 - glow; 8 - USB-drive; 9 - Power Supply.
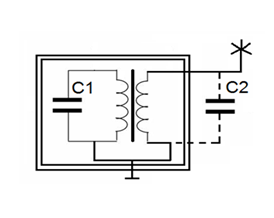
Metal cylinder 15 mm in diameter connected to an antenna 2 is positioned on the quartz surface of the electrode 5, the reverse side of which is covered with a transparent conductive coating 4; from the generator 3 every second a voltage in the form of a pulse sequence of up to 7 kV amplitude, 10 microsecond duration at a frequency of 1 kHz is applied to the coating. Ultraviolet light 7 is transformed by optoelectronic system 6 in a series of images, which are analyzed in a computer. Experimental system can be represented as an equivalent circuit of the connected LC circuits (Figure 2).

Figure 2 Equivalent circuit diagram of the experimental setup, where C1 corresponds to the capacity of the electronic circuit of the Bio-Well device, C2 - the equivalent capacitance of the antenna in the premises.
Discharge develops due to displacement currents between the antenna 2 and grounding.18 Depending on the availability of fields of different nature in the environment, the chemical composition of the air and the state of the conductive objects, conditions of electromagnetic wave propagation in space are changing, therefore the currents in the system are redistributed, thus influencing parameters of the glow. Thus, this experimental system can react to changes in the electrical capacitance of the environment surrounding it and the presence of the conductive objects. In other words, we may say that the signal depends on the propagation of standing electromagnetic waves in space.
Data processing was carried out in specially designed software. For analysis both the absolute values of the parameters and their standard deviations in the series were taken into consideration. The software allows to perform automatically statistical analysis of a time series data. The program calculates the mean and standard deviation for each interval and statistical comparisons of adjacent intervals by the method of Student's t and Mann-Whitney tests. All input data are stored in a file for further processing in the statistical programs. A large series of studies and field trials in Russia, Venezuela, Colombia, England, in the period 2008-2019 showed that the instrument is sensitive to changes in the environmental parameters, like sun and moon eclipses19,20 and changes of weather.19
Study design
Bio-Well device with a sensor was positioned in the laboratory and turned on in an automatic off-line mode, after that all people left the room. After about an hour of background recording person entered the room and turned on music, and then left the room. Music was playing for 20 minutes, and then the signal was recorded for about one more hour. By the end of this time device was turned off and data were processed in the Bio-Well programs. In the experiment 5 different files of the modern electronic music “Yippi Wave 3.0” (https://yippiweb.com/what-is-wave) in *wav format and several files of Handel music have been used.
8 experiments were conducted and in all the Energy of photons measured in Bio-Well software decreased after playing music. Results are presented in Table 1, example of data processing presented at Figure 3. Playing Handel music had no effect on the device parameters.
Experiment N |
Date, mm.dd.yy |
Music file |
Energy 1 |
Energy 2 |
t-test |
1 |
12.13.19 |
1 |
3.98+/- 0.13 |
3.56+/- 0.13 |
< 0.001 |
2 |
12.1619 |
1 |
2.84+/- 0.01 |
2.81+/- 0.01 |
< 0.001 |
3 |
12.1719 |
1 |
2.82+/- 0.01 |
2.76+/- 0.01 |
< 0.001 |
4 |
12.18.19 |
1 |
2.79+/- 0.01 |
2.75+/- 0.01 |
< 0.001 |
5 |
12.19.19 |
2 |
2.69+/- 0.01 |
2.66+/- 0.01 |
< 0.001 |
6 |
12.20.19 |
3 |
2.65+/- 0.01 |
2.61+/- 0.01 |
< 0.001 |
7 |
12.20.19 |
4 |
3.18+/- 0.02 |
3.08+/- 0.02 |
< 0.001 |
8 |
12.21.19 |
5 |
3.11+/- 0.03 |
3.07+/- 0.03 |
0.04 |
Table 1 Comparison of the Energy of photons measured in Bio-Well software before (1) and after (2) playing music. Data is averaged for 1 hour of measurements
According to the software developers (https://yippiweb.com/what-is-wave), their device uses the principle of scalar waves, or longitudinal waves, proposed by Nikolai Tesla21 and explained from spin-torsion principles of quantum mechanics.22 Without going into a discussion about the nature of this phenomenon, we realize that it is possible to modulate the radiation of the phone in a certain way using the application on the phone. One of the sensitive elements in the Bio-Well device is a pulsed, so-called "sliding" gas discharge,18 which develops along the surface of the electrode. It is known that the electromagnetic field affects the parameters of this discharge.15 In the experiments under discussion, the device was in an initial electromagnetic field, which is constantly present in the surrounding space. It should be noted that in different days the initial parameters of the discharge differed (Table 1), which indicates the change of conditions of the environment and, above all, the electromagnetic field. When the music file was turned on, the electromagnetic field was modulated, which affected the parameters of the gas discharge and led to changes in the registered parameters. At the same time, it caused the redistribution of a quasi-stable configuration of positive charges on the surface of the dielectric electrode, which led to the effect of "memory" - saving the parameters for certain measurement time.
This study should be considered a pilot study and the results are preliminary. We need to conduct experiments with different sources of both acoustic and electromagnetic signals and the possibility of their registration by the Bio-Well device. At the same time, the observed effect seems to us to be interesting and we will listen to all suggestions for improving the research protocol.
None.
No conflicts to declare.
No conflicts to declare.

©2020 Korotkov, et al. This is an open access article distributed under the terms of the, which permits unrestricted use, distribution, and build upon your work non-commercially.