Journal of
eISSN: 2572-8466


Research Article Volume 2 Issue 1
1Department of Genetic Engineering and Biotechnology, University of Dhaka, Bangladesh
2Department of Mathematics and Natural Sciences, BRAC University, Bangladesh
Correspondence: Abul Bashar Mir Md. Khademul Islam, Associate Professor, University of Dhaka, Department of Genetic Engineering & Biotechnology, University of Dhaka, Dhaka-1000, Bangladesh, Tel 880-2-9661900
Received: November 21, 2016 | Published: February 7, 2017
Citation: Mostafa SM, Murad MW, Mohammad E, et al. Intronic MiRNA MiR-3666 modulates its host gene FOXP2 functions in neurodevelopment and may contribute to pathogenesis of neurological disorders schizophrenia and autism. J Appl Biotechnol Bioeng. 2017;2(1):32-45. DOI: 10.15406/jabb.2017.02.00022
MicroRNAs (miRNAs) are approximately 22-nucleotide-long, non-coding RNAs that bind to complementary mRNAs with inhibitory effect. An intronic miRNA is embedded in a particular gene called its host gene. Our study focuses on the Homo sapiens intronic miRNA-host gene pair, hsa-miR-3666 and FOXP2. Previous report of co-expression of miR-3666 and FOXP2 indicates possible regulation of FOXP2 functions by miR-3666. However, direct correlation has not been shown yet. Therefore, we took a computational approach to determine if and how such modulation occurs. ChIP-seq identified FOXP2 targets and putative miR-3666 targets showed a significant overlap of 574 common target genes. Functional enrichment analysis of common targets revealed over-representation of KEGG pathways and Gene Ontology modules associated with neurodevelopment. These modules, along with further literature mining and protein-protein interaction analysis of FOXP2 and miR-3666 identified several specific genes associated with neurodevelopment and finally integration of transcriptomic expressions data lead to the selection of four models depicting the mechanisms by which miR-3666 can modulate FOXP2 functions. Model 1 illustrates that during neurodevelopment, miR-3666 can directly modulate the functions of FOXP2 through regulation of common targets, such as IGF1 and EFNB2, whereas model 2 shows miR-3666 can also indirectly modulate FOXP2 functions by considering targets that are not common for the intronic miRNA-host gene pair, for example CDH2 and LMO4. This direct and indirect regulation is necessary for precise spatial and temporal expression of genes during neurodevelopment. Models 3 and 4 exhibit mechanisms in which the interactions of miR-3666 and FOXP2 with target genes contribute to the pathogenesis of schizophrenia and autism respectively.
Keywords: FOXP2, miR-3666, target genes, interaction, co-regulation, neurodevelopment, schizophrenia, autism, autism spectrum disorder
ASD, autism spectrum disorder; DN, differentiated neuron; FC, fold change; GEO, gene expression omnibus; GOBP, gene ontology biological process; GOCC, gene ontology cellular component; GOMF, gene ontology molecular function; HESC, human embryonic stem cell; IPC, intermediate progenitor cell; miRNA, microRNA; NE, neural ectoderm; NPC, neural progenitor cell; NSC, neural stem cell; NT2, NTera2; PHS, pitt-hopkins syndrome; TF, transcription factor
Mature microRNAs (miRNAs) are 18-22 nucleotides long and are known to repress translation by binding to the complementary 3'-UTRs of their target mRNAs. This binding results in inhibition of translation initiation or post-initiation translational block. Each miRNA can recognize multiple target mRNAs that may be related to one or more biological processes; hence miRNA can have diverse effects.1 Our study involves a type of miRNA called intronic miRNA that is embedded in the introns of its "host gene". The definition of intronic miRNA depends on two parts: first, sharing the same promoter with their encoded genes and second, being spliced out of the transcript of their encoded genes and further processed into mature miRNAs.2 These intronic miRNAs may support or counteract the functions of its host gene.3 Forkhead genes are a subgroup belonging to the helix-turn-helix class of proteins.4 FOXP2 (Forkhead box P2) protein contains a FOX DNA-binding domain and a large polyglutamine tract and is evolutionarily conserved, binding directly to 300 to 400 gene promoters in the human genome and hence can regulate a variety of genes.5 FOXP2 can form homodimers and heterodimers with FOXP1 and FOXP4; this dimerization is a requirement for DNA-binding.6 Heterodimers of FOXP2 with FOXP1 may have different transcriptional outcomes than their homodimers. Hence, situations may arise where low levels of FOXP2 could repress transcription by heterodimerization with FOXP1, but as FOXP2 increases in amount, competition between FOXP2 homodimers and endogenous FOXP1 can lead to transcriptional activation.7 FOXP2 is said to have dual functionality, either repressing or activating gene expression.8 It generally works as a repressor, however, its over expression has been shown to increase expression of some genes such as TAGLN and CER1, suggesting a role in transcriptional activation.7 FOXP2 hosts the intronic miRNA, miR-3666. Though not much work has been done on miR-3666, its targets have been predicted and deposited in various databases. A few recent experiments have shown the repression activity of miR-3666 on targets such as MET and ZEB1 in thyroid carcinoma and cervical carcinoma cells, respectively.9,10
Previous experiments11,12 have demonstrated how intronic miRNA can modulate host gene functions. Since little research has been done with miR-3666, its potential functions with respect to modulation of host gene activities are largely unknown. Furthermore, the co-expression of FOXP2 and miR-3666 has not only been computationally predicted; it has also been confirmed in vitro .1 We therefore sought to study if miR-3666 can play an antagonistic or synergistic role in regulation of FOXP2 functions and if it can, the mechanisms by which it does so. This regulatory function of intronic miRNA has critical implications in the designing of therapeutics or its role as biomarkers. miRNAs have been shown to be effective as therapeutics due to several reasons such as its small, conserved sequence; its high binding specificity and affinity; and overall desirable pharmacokinetic properties.13 Circulating miRNAs have also been considered good candidates as biomarkers.14 In this study, we took a "data-driven and knowledge-based approach" to find functional relations between intronic miRNA miR-3666 and its host gene, FOXP2. We hypothesized that the presence of common target genes for miR-3666 and FOXP2 mean that they are involved in regulation of a common pathway or biological function. Moreover, miR-3666 was also expected to have a synergistic or antagonistic effect on host gene function. Functional enrichment analysis of KEGG pathways and Gene Ontology (GO) on common targets from ChIP-seq experiments highlighted pathways, biological processes and sets of genes that are enriched for both miRNA and host gene.
Identification of hsa-mir-3666 (miR-3666) and FOXP2 targets
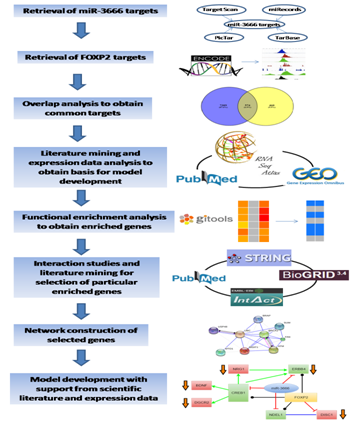
Several miRNA target databases were searched for putative targets of miR-3666 which includes TargetScan (www.targetscan.org) (Release 6.2: June 2012),15 TarBase (diana.imis.athena-innovation.gr/DianaTools),16 PicTar (http://pictar.mdc-berlin.de)17 and miRecords (c1.accurascience.com/miRecords/)18 (Figure 1). ChIP-seq experiment datasets of FOXP2 were downloaded from Encyclopedia of DNA Elements (ENCODE) ChIP-seq Experiment Matrix (human genome version hg19) dataset UCSC 2003-2012.19 The closestBed feature of BEDTools 20 was used to identify nearest Ensembl (version 70)21 transcript from the ChIP-seq peak as the target gene.
Overlap analysis
Overlap analysis of the targets of FOXP2 and that of miR-3666 was carried out using the tool Venny (version 2.1.0).22 Significance of overlap analysis was based on Chi-square test.
Literature mining and expression data analysis
Extensive text-mining related to both FOXP2 and miR-3666 revealed their respective functions at the molecular level. Knowledge about the pathways and processes they are directly or indirectly involved; in their spatial and temporal expression patterns; and the disorders that may result due to perturbations in their function or expression, was used to create the basis upon which our models were developed. The expression profile of the selected genes across various stages of neurodevelopment were obtained from GEO series GSE28633.23 The data were log2-transformed and the expression values of multiple probes of the same gene were averaged, these values were then visualized as a heatmap using Matrix2png.24 For differential expression, the samples were placed into test and control groups and GEO2R analysis was carried out with default parameters. Log2FC (fold change) cut off was set to -0.5 and +0.5 for significant differential expression. OncoDrive analysis of Gitools25 was used for the detection of "driver genes". The results of the driver gene analysis were visualized as a heatmap in Gitools using P value scale with corrected right p-value less than 0.05. To obtain expression profile of miR-3666, Gene Expression Omnibus (GEO)26,27 series "GSE15888"1 was subjected to GEO2R analysis. The samples in GSE15888 were placed into defined groups and the test was run using default parameters.
Functional enrichment analysis
Functional annotation of target genes is based on Gene Ontology (GO)28 as extracted from EnsEMBL 29 and KEGG pathway database.30 Accordingly, all genes are classified into the ontology categories biological process (GOBP) and pathways when possible. We have taken only the GO/pathway categories that have at least 10 genes annotated. We used Gitools for enrichment analysis and heatmap generation.25 Resulting p-values were adjusted for multiple testing (p-value less than 0.01) using the Benjamin and Hochberg's method of False Discovery Rate (FDR).31,32 The candidate gene list for schizophrenia was collected from Schizophrenia Gene Resource33 whereas candidate genes for autism were collected from AutismKB34 and SFARI gene databases.35 Considering the candidate genes, we carried out enrichment analysis to find whether the disorders are significantly enriched when common target genes are considered.
Selection of genes and development of models
In order to construct a model to demonstrate how the intronic miRNA miR-3666 affects the function of its host gene, we selected a particular set of genes. These genes were selected based on their significance in neurodevelopment and potential in being directly or indirectly affected by FOXP2 and miR-3666. Protein-protein interaction studies were done using STRING (version 10.0),36,37 BioGRID (version 3.4)38 and IntAct39 databases. STRING database was used to build a protein-protein interaction network model keeping all parameters in default.
Host and intronic miRNA targets overlap significantly
First we sought to find the target genes of miR-3666. Since miR-3666 has only recently been added to miRNA databases, experimentally validated targets are not available yet. The targets of miR-3666 downloaded from major miRNA target databases-Tarbase, TargetScan, PicTar, miRecords were combined to form a unique union set of 1028 target genes. This approach allowed a comprehensive method in determination of putative targets of miR-3666 and therefore an increased confidence in the results. Similarly, by analyzing FOXP2 ChIP-seq data in SK-N-MC cell line we identify total 7883 FOXP2 targets. In order to study the role of miR-3666 in modulating its host gene functions, we analyzed the target genes that are affected by the action of both host gene and intronic miRNA. Overlap analysis in a venn-diagram showed that miR-3666 and FOXP2 have 574 common targets (Figure 2A). Chi-square test shows that the overlap is significant (p-value < 10-16 and Chi-square value 1817.16) and much higher than expected value (percentage deviation is + 351.3%)
FOXP2 and miR-3666 perform common role in neurodevelopment
FOXP2 has widespread expression in humans (Supplementary Figure S1). It is expressed at high levels in the developing brain, with lower expression in various parts of the human brain. Besides the brain, it is expresses in the lungs and gut as well.40,41 Although FOXP2 has extensive expression in the developing brain, a quite low expression in the adult brain42 suggests that the expression of FOXP2 is developmentally regulated. Mutational analysis in several studies43,44,45 have demonstrated the association of non-functional FOXP2 with motor dysfunction, cerebellar abnormalities and early postnatal lethality. In an experiment that studied miRNA expression during the process of neural differentiation using an RA (retinoic acid)-induced embryonal carcinoma NTera2/D1 (NT2) cell line, miR-3666 was observed to continue being expressed in fully differentiated NT2-derived post-mitotic neurons and/or NT2-derived astrocytes. The differential expression of miR-3666 during the experiment indicated its role in regulation of neurodevelopment, particularly the peak in miR-3666 expression between 6 and 14 days of treatment implies a biological role in cell-fate determination1 (Supplementary Figure S2). Above results and information indicates that miR-3666 and FOXP2 are involved in neurodevelopment so that our analysis focused on FOXP2 and miR-3666 co-regulation of neurodevelopmental processes.
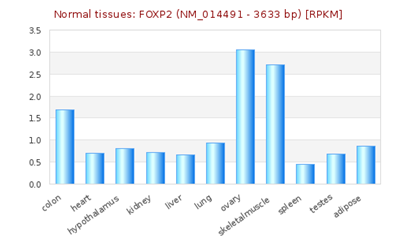
Supplementary Figure S1 RNA -seq atlas displaying relative levels of FOXP2 expression across various organs. The height of blue bars represents the expression levels of FOXP2 [source: RNA-Seq Atlas].
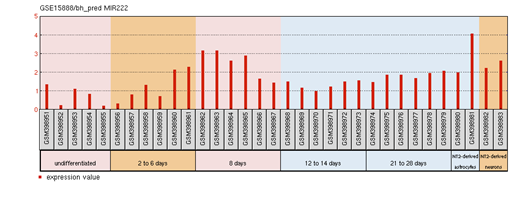
Supplementary Figure S2: miR-3666 expression profile in NT2/D1.
The profile diagram is titled by the GEO accession number (GSE15888) and the probe ID (bh_pred MIR222). The groups shown are
The red bars represent the expression measurement extracted from the median-centered, log2 signal intensity values column of the samples.
Over-represented Gene Ontologies and KEGG pathways of common targets are related to neurodevelopment, which are not modulated by miR-3666 lone targets
Enrichment analysis allows us to understand and quantitatively measure whether there are statistically significant changes in a set of biological annotations. We sought to determine the host gene functions that are modulated by intronic miRNA, miR-3666. Hence we have done enrichment analysis using Gitools25 to obtain significantly over-represented Gene Ontology Biological Process (GOBP) terms (Figure 2B) and KEGG pathways (Figure 2C) and on the common and unique targets of FOXP2 and miR-3666.Although functional enrichment analysis showed enrichment for a diverse set of processes (Figure 2B & 2C) at a very low p-value of 0.01, there is a clear predominance of functions such as "neuron differentiation"; neurological disorders; and signaling pathways involved in neurodevelopment, neurogenesis or gliogenesis in commonly regulated targets of FOXP2 and miR-3666. All of the enriched KEGG pathways and GO Biological Processes were then analyzed for related enriched genes. By combining all the enriched genes obtained from both KEGG and GOBP modules, we hence obtained 249 common target genes that were significantly enriched for all pathways and processes related to neural development (Supplementary Table S3).
AAK1 |
CDC73 |
ERBB4 |
KIT |
NDEL1 |
PRKD3 |
SOX4 |
TRIB1 |
ABCC4 |
CEBPE |
EREG |
LDLRAD3 |
NEDD4L |
PRNP |
SOX5 |
TRIM2 |
ACVR1 |
CEP120 |
FBXW11 |
LDLR |
NEUROD1 |
PSD3 |
SP1 |
TRPC3 |
ADCY1 |
CHRM2 |
FERMT2 |
LIN28A |
NFIB |
PTPN11 |
SPATA2 |
TSC1 |
AGFG1 |
CHST11 |
FMR1 |
LMLN |
NPNT |
PTPRD |
SPEN |
TTPA |
AHR |
CLTC |
FNBP1 |
LRP12 |
NPTN |
QKI |
SPHK2 |
TXNIP |
AK4 |
COL19A1 |
FOXP1 |
LRP1B |
NR3C1 |
RAB5B |
SPOCK1 |
UHMK1 |
APCDD1 |
COL6A3 |
FRMD6 |
LRP6 |
NRP1 |
RACGAP1 |
SPRED1 |
ULK2 |
ARHGAP24 |
COX7A2L |
FRZB |
LRP8 |
NRP2 |
RALBP1 |
SRGAP3 |
UNC13A |
ARHGEF12 |
CPEB2 |
FZD3 |
LRRK2 |
NRSN1 |
RAPGEF4 |
STAT3 |
VANGL1 |
ARID5B |
CPEB4 |
GAB1 |
MAFB |
NUS1 |
RNF41 |
STAT6 |
VAPA |
ARL4A |
CREB1 |
GCLC |
MAGI1 |
OTX2 |
ROBO2 |
STIM2 |
VAV2 |
ARX |
CREB5 |
GDA |
MAML3 |
PDE4D |
ROCK2 |
STK4 |
WASL |
ATP2A2 |
CUL3 |
GJA1 |
MAP3K13 |
PDE5A |
RPS6KA2 |
SULF1 |
WHSC1L1 |
ATP6V1B2 |
CXCL12 |
GNA12 |
MAP4 |
PDE7B |
RRAGD |
SYT2 |
WNT10A |
ATXN1 |
DCBLD2 |
GRIK2 |
MAP7 |
PDE8A |
RTN1 |
TACC1 |
WNT2B |
BAG5 |
DENND1A |
HBP1 |
MAPK10 |
PI4KA |
RUNX1T1 |
TAF4B |
XYLT1 |
BCL11A |
DICER1 |
HECA |
MAPK1 |
PIK3C2A |
RXFP2 |
TAF4 |
YES1 |
BHLHE41 |
DLC1 |
HEG1 |
MBD2 |
PIK3IP1 |
S1PR1 |
TANC1 |
ZBTB7B |
BMPR1B |
DLG5 |
HES1 |
MBNL1 |
PLEKHG5 |
S1PR2 |
TAOK1 |
ZEB1 |
BMPR2 |
DNM2 |
HOMER1 |
MDFIC |
PLEKHG5 |
SBF2 |
TBL1XR1 |
ZEB2 |
BPTF |
DPYSL2 |
HSPA8 |
MDGA2 |
PLLP |
SETD7 |
TBPL1 |
ZFAND5 |
BTG1 |
EDA |
IGF1 |
MEOX2 |
PMEPA1 |
SH2B3 |
TCF4 |
ZFPM2 |
CABLES1 |
EFNB2 |
IGFBP5 |
MET |
POU3F2 |
SHANK2 |
TENM1 |
ZIC5 |
CALB1 |
EGR3 |
INHBB |
MLL |
POU4F1 |
SHC3 |
TFDP2 |
ZNF3 |
CALM1 |
EIF2C1 |
ITGA4 |
MLTK |
PPARGC1A |
SIK1 |
TGFB2 |
ZNRF3 |
CALM2 |
EMX2 |
ITGB8 |
MYB |
PPFIA2 |
SIPA1L2 |
TGFBR2 |
|
CANX |
ENAH |
ITPKB |
MYO10 |
PPP1R9A |
SMAD2 |
THSD7A |
|
CAPRIN2 |
EPB41L1 |
JARID2 |
MYT1L |
PRICKLE2 |
SMAD5 |
TIMP2 |
|
CAV2 |
EPDR1 |
KCNN3 |
NAV1 |
PRKAA1 |
SNAP25 |
TNRC6B |
|
CCDC88A |
EPHA7 |
KIAA1462 |
NCOA1 |
PRKAB1 |
SNX2 |
TNRC6C |
|
CCND3 |
EPS15 |
KIF13A |
NCOA3 |
PRKACB |
SOX21 |
TP63 |
Supplementary Table S3 List of FOXP2 and miR-3666 target genes that are enriched forneural development related terms in GOBP and KEGG pathways.
Language disorder and cognitive deficiency is commonly considered as one of the principal symptoms in several disorders, such as schizophrenia and autism. Hence, FOXP2 is likely to be a good candidate gene since its mutation has been reported to be associated with speech and language deficits.46,47,48 FOXP2 has also been reported to be associated with schizophrenia49,50,51,52 and autism.53,54,55,56 FOXP2 may therefore directly cause the disease or affect its downstream targets that lead to the development of such disorders. We see that, when considering candidate genes of the disorders and common targets of FOXP2 and miR-3666, both schizophrenia and autism are significantly enriched (Figure 2D).
Four models developed show mechanisms by which miR-3666 might modulate FOXP2 functions in neurodevelopment and pathogenesis of neurological disorders
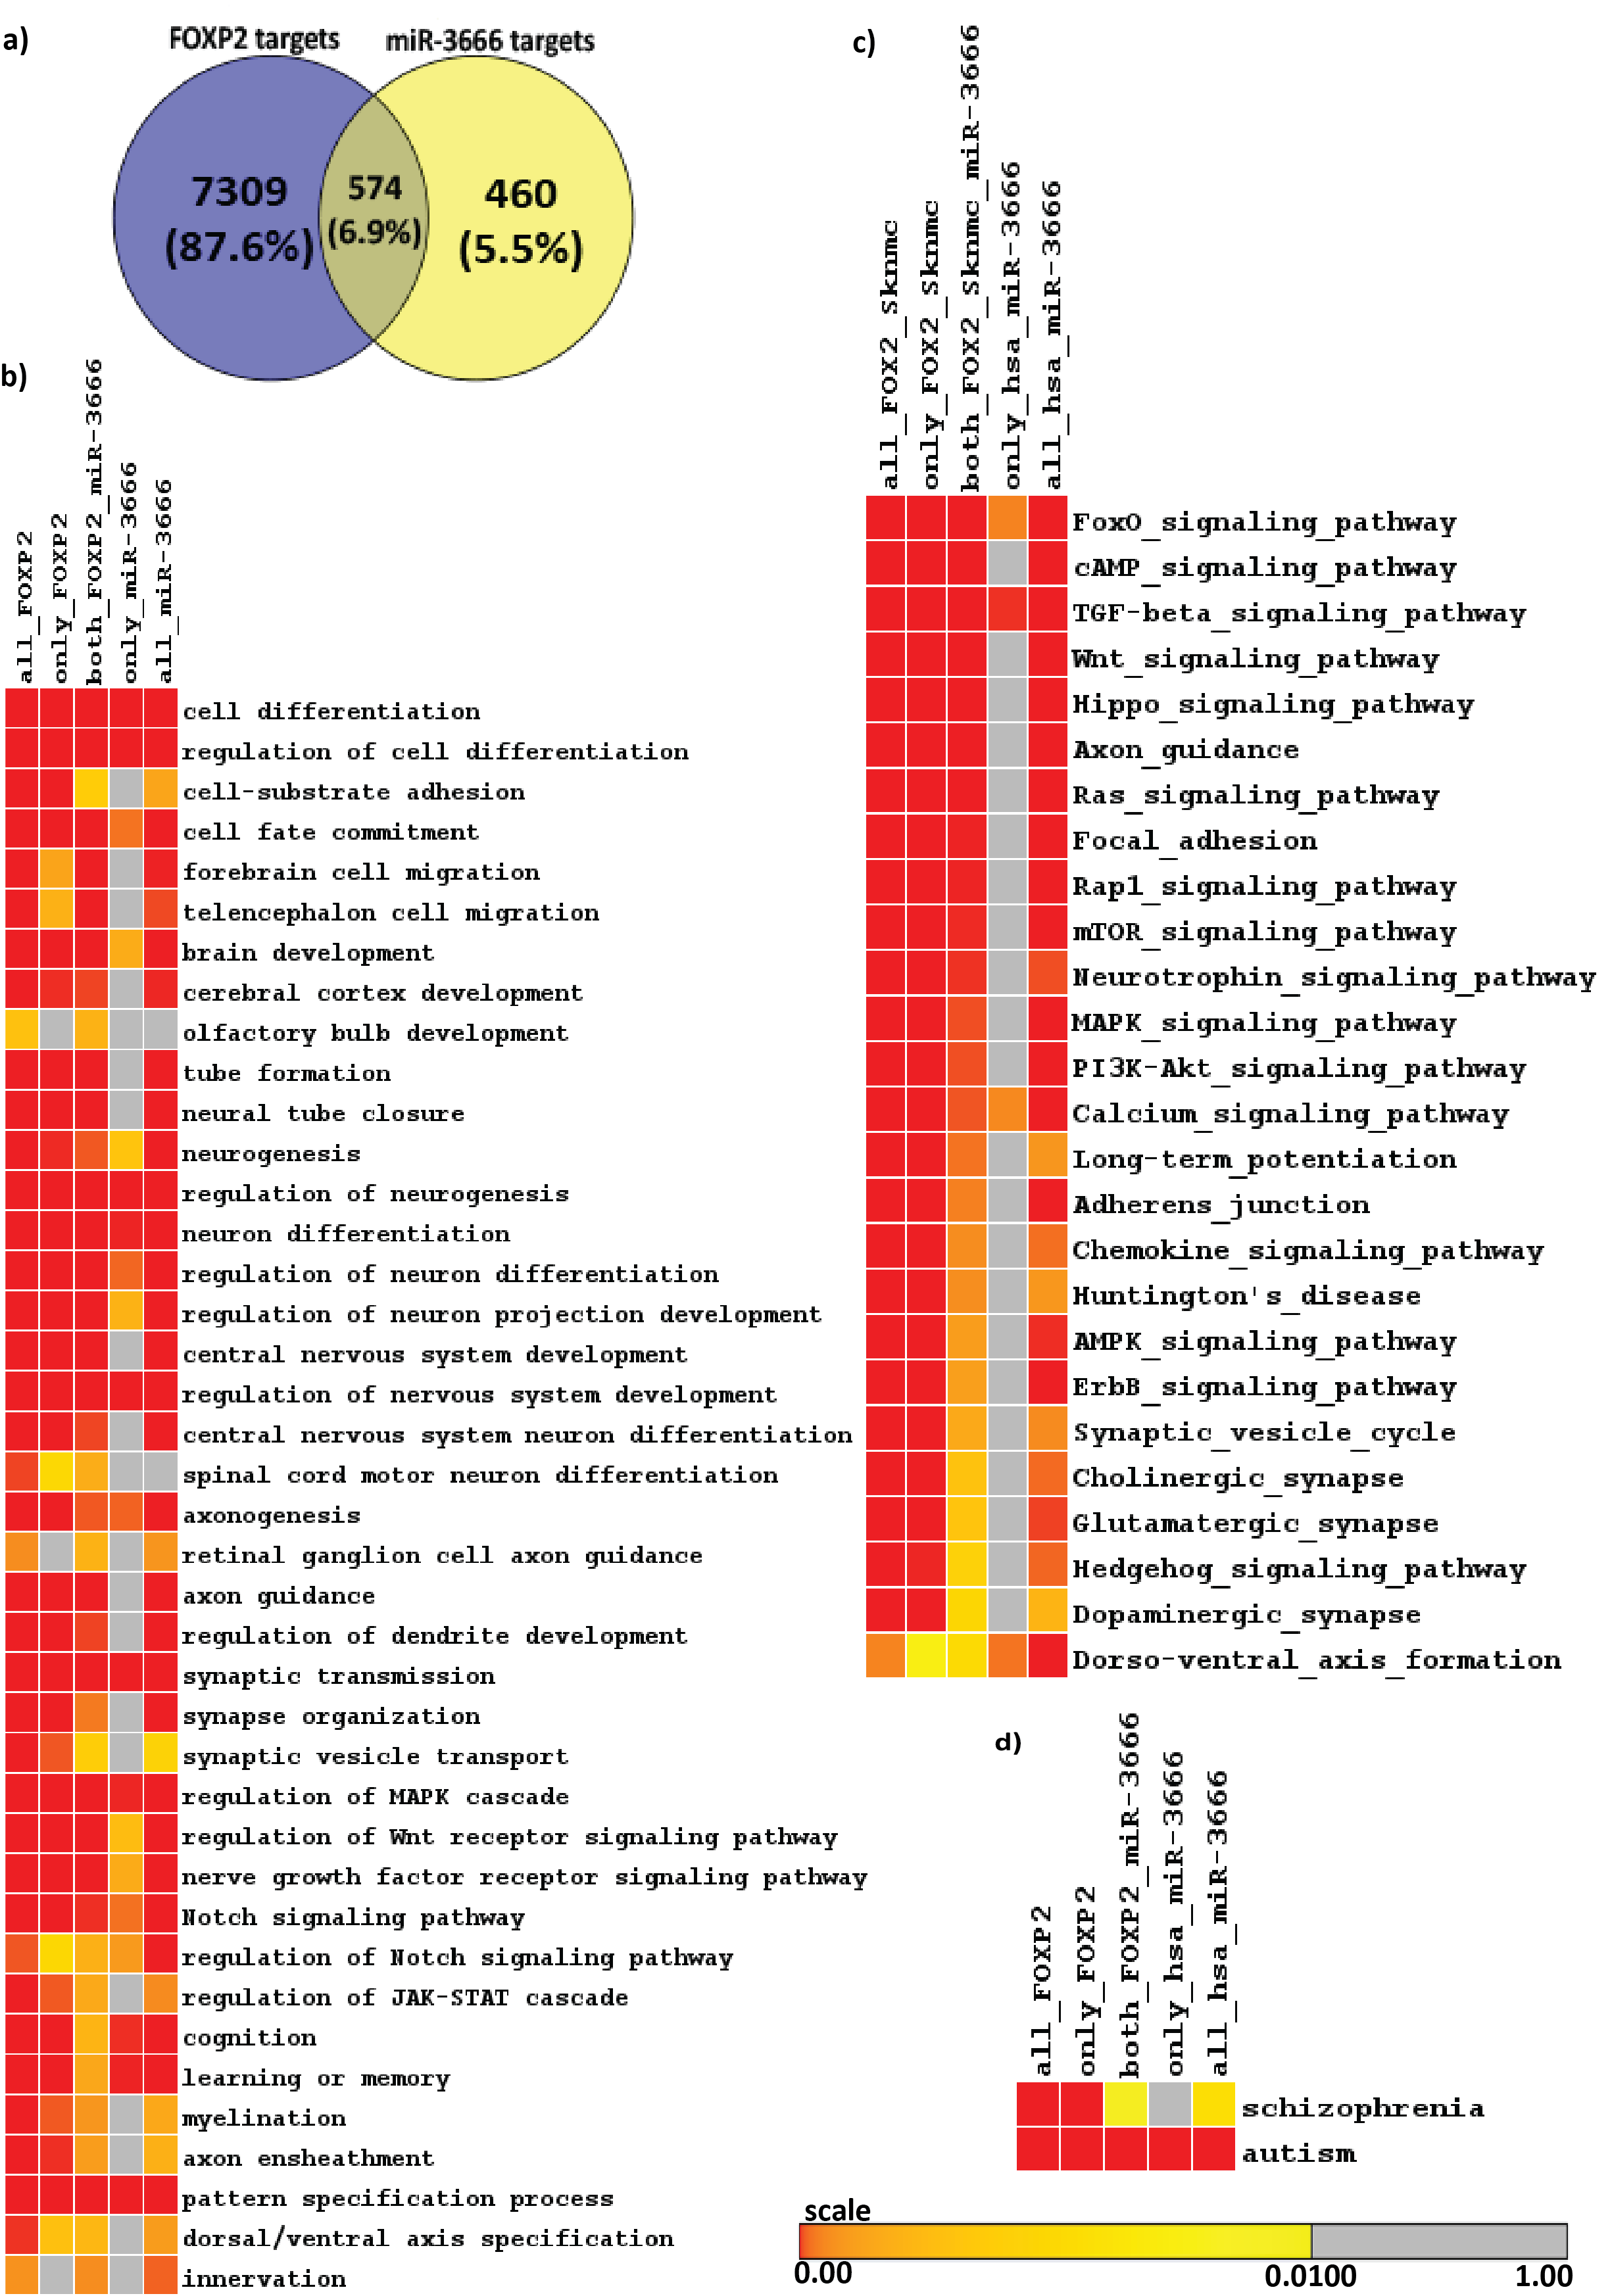
Figure 2 Identification of FOXP2 and miR-3666 common targets and functional overrepresentation analysis of targets.
A. Venn representation of common and unique targets genes of host genes and intronic miRNA. The left circle represents FOXP2 target genes, where the number in the blue circle corresponds to genes exclusive for FOXP2. The right circle represents miR-3666 target genes, where the number in the yellow circle corresponds to genes exclusive for miR-3666. The intersection area of the two circles represents the number of target genes shared by both FOXP2 and miR-3666.
Enriched heatmap of:
B. Gene Ontology Biological Process (GOBP) terms and
C. KEGG pathways; and
D. Enriched neurological disorders schizophrenia and autism. Multiple test corrected p-values are represented in color coded heatmaps. The higher the color intensity towards red, the greater is the significance, while higher color intensity towards yellow represents lower significance. Gray represents insignificant p-value.
A thorough study of previous FOXP2 and neurodevelopment-related research revealed several key genes for neurodevelopment. Previous experiments that identified FOXP2 targets using methods such as ChIP-chip and ChIP-quantitative PCR57,58,7,8 show FOXP2 targets are enriched in functions related to synaptic plasticity, neurotransmission and axon guidance. Some of these targets have also reported to be differentially expressed in humans and have been associated with cognitive disorders such as autism.7 Hence, we selected common target genes that may have these exact or related functions. Additionally, proliferation and differentiation in neurogenesis implies that cell cycle re-entry and exit is also involved. Hence, we also selected common target genes that are crucial in the cell cycle, for example, cyclin D3 (CCND3).59 We also studied FOXP2 interactions using STRING36,37 (Figure 3A), BioGRID38 and IntAct.64 For a more extensive study, we referred scientific literature60-69 and took into consideration some genes that were not common targets but play important roles in the nervous system or in pathogenesis of neurological disorders (for example, CNTNAP2 and BDNF) and showed potential in being indirectly co-regulated by FOXP2 and miR-3666 through common target genes. Therefore, a total of 30 genes were selected for developing our models (Supplementary Table S4). STRING36,37 analysis of the proteins of selected genes (Figure 3B) highlights important interactions, for example, the binding of DISC1 (FOXP2 target) with NDEL1 (common target gene). Additionally, it shows MET and ERBB4 proteins may act as hubs. Since STRING did not display interactions for all proteins (for example, SOX21), we carried out interactions studies using other databases, namely BioGRID 38 and IntAct 39 for a more thorough analysis. We compiled a list of candidate genes for schizophrenia and autism from different databases and subjected them to overlap analysis with our list of selected 30 genes (Figure 4 & Supplementary Table S5). Models were developed based on the selected genes that have been linked to the particular disorder.
Gene name |
Gene symbol |
Achaete-Scute Family BHLH Transcription Factor 1 |
ASCL1 |
Brain-Derived Neurotrophic Factor |
BDNF |
Cyclin D3 |
CCND3 |
Cadherin 2 |
CDH2 |
Contactin Associated Protein-Like 2 |
CNTNAP2 |
CAMP Responsive Element Binding Protein 1 |
CREB1 |
DiGeorge Syndrome Critical Region Gene 2 |
DGCR2 |
Disrupted In Schizophrenia 1 |
DISC1 |
Ephrin B2 |
EFNB2 |
Empty Spiracles Homeobox 2 |
EMX2 |
Erb-B2 Receptor Tyrosine Kinase 4 |
ERBB4 |
Forkhead Box P1 |
FOXP1 |
Hes Family BHLH Transcription Factor 1 |
HES1 |
Insulin Like Growth Factor 1 |
IGF1 |
LIM Domain Only 4 |
LMO4 |
MET Proto-Oncogene, Receptor Tyrosine Kinase |
MET |
NudE Neurodevelopment Protein 1 Like 1 |
NDEL1 |
Neuronal Differentiation 1 |
NEUROD1 |
Neurogenin 1 |
NGN1 |
Neurogenin 2 |
NGN2 |
Neuregulin 1 |
NRG1 |
Paired Box 6 |
PAX6 |
POU Class 3 Homeobox 2 |
POU3F2 |
Protein Tyrosine Phosphatase, Non-Receptor Type 11 |
PTPN11 |
Protein Tyrosine Phosphatase, Receptor Type J |
PTPRJ |
Synaptosome Associated Protein 25kDa |
SNAP25 |
SRY (Sex Determining Region Y)-Box 2 |
SOX2 |
SRY (Sex Determining Region Y)-Box 21 |
SOX21 |
SRY (Sex Determining Region Y)-Box 4 |
SOX4 |
Transcription Factor 4 |
TCF4 |
Supplementary Table S4 List of selected 30 genes full name and symbols.
Schizophrenia candidate genes |
Autism candidate genes |
BDNF |
BDNF |
DGCR2 |
CNTNAP2 |
ERBB4 |
ERBB4 |
FOXP2 |
FOXP1 |
NRG1 |
FOXP2 |
MET |
|
PAX6 |
|
PTPN11 |
|
SNAP25 |
|
TCF4 |
Supplementary Table S5 List of selected genes linked to neurodevelopmental disorders schizophrenia and/or autism.
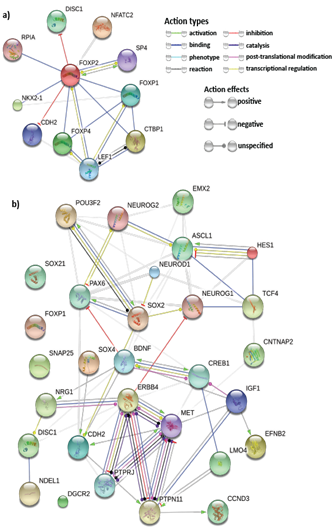
The network nodes represent proteins whereas the edges represent protein-protein associations. Small nodes represent protein of unknown 3D structure whereas large nodes mean some 3D structure is known or predicted. The colored nodes are for query proteins and first shell of interactors whereas white nodes are second shell of interactors.
With this list of genes we have developed 4 models. Models 1 and 2 depict the joint regulation of miR-3666 and FOXP2 in neurodevelopmental processes. Model 1 (Figure 5A) shows interactions of miR-3666 and FOXP2 with mainly the common target genes and genes that have regulatory effects on FOXP2. Model 2 (Figure 5B) involves many target genes that are either unique to miR-3666 or FOXP2 but not both. However, model 2 shows how these genes may be indirectly regulated by both the host gene and the intronic miRNA. In models 3 and 4, we propose how FOXP2 and miR-3666 can jointly regulate the expression of these candidate genes and influence the pathogenesis of schizophrenia (Figure 5C) and autism and ASD (Autism Spectrum Disorder) (Figure 5D), respectively.
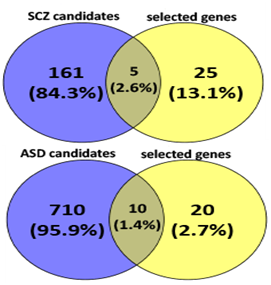
The left circle represents disease candidate genes, where the number in the blue circle corresponds to genes exclusive for the disease. The right circle represents our selected genes, where the number in the yellow circle corresponds to genes exclusive for the selected genes. The intersection area of the two circles represents the number of selected genes that are also disease candidate genes.
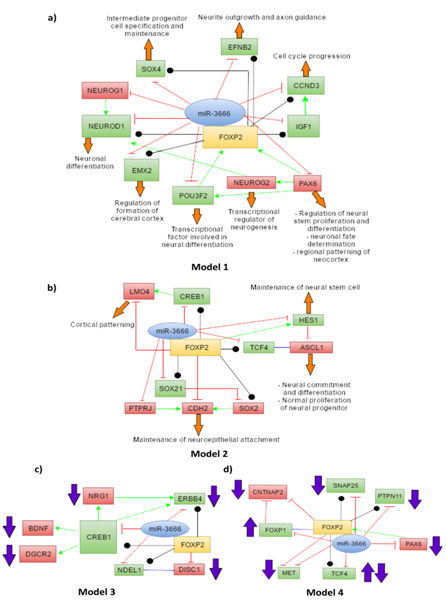
The common target genes are shown in green whereas targets that are not shared by miR-3666 and FOXP2 are shown in red. The green arrows represent directional activation and the blunt-ended red lines show directional inhibition. The black lines with circled ends represent interaction and the blue lines represent binding (or dimerization). The orange block arrows associated with the genes show the function of the particular genes and the purple block arrows show levels of candidate genes found in diseased individuals.
miR-3666 directly or indirectly regulates FOXP2 functions in neuronal differentiation
As model 1 (Figure 5A) shows, miR-3666 can regulate neuron differentiation by directly regulating the ChIP-Seq targets of FOXP2-NEUROD1, IGF1, CCND3 and SOX4. FOXP2 may control neuronal differentiation by interacting with NEUROD1; miR-3666 regulates this function by directly inhibiting NEUROD1 itself or its activators, NEUROG1 and NEUROG2. Additionally, inhibition of the FOXP2 targets CCND3 and IGF1 by miR-3666 may promote cell cycle exit and neural differentiation. The co-regulation of SOX4 by miR-3666 and FOXP2 is important for the proper transition from radial precursor to intermediate progenitor cells (IPCs).70 As model 2 (Figure 5B) shows, ASCL1 may be indirectly regulated by both FOXP2 and miR-3666 via common targets TCF471 and HES1.72,73 Though the ChIP-seq data we used did not list ASCL1 as an experimentally determined target, literature review has revealed that FOXP2 strongly represses ASCL1.74 Additionally, the joint regulation of the common target SOX21 by miR-3666 and FOXP2 maintains the balance of SOX2 and SOX21 activities that, in turn, is required for the balance of progenitor cell maintenance and the progression to postmitotic neural development.75,76 Furthermore, downregulation of CDH2 is necessary for neuronal differentiation to occur.66 FOXP2 directly represses CDH2, leading to detachment of differentiating neurons from epithelial sheet77 we presume miR-3666 may suppress CDH2 indirectly via suppression of Protein Tyrosine Phosphatase, Receptor Type, J (PTPRJ). According to IntAct database, PTPRJ dephosphorylates CDH2. PTPRJ may act similarly to PTP1B (another phosphatase) by maintaining cells in an adhesion-competent state by dephosphorylating β-catenin.78,79
miR-3666 directly or indirectly regulates FOXP2 functions in neurite outgrowth and cortical patterning
As model 1 (Figure 5A) proposes, miR-3666 regulates neurite outgrowth, axon guidance and synaptic plasticity by regulating the gene EFNB2, a well-validated ChIP-Seq target of FOXP2. miR-3666 can regulate proper cortical patterning through regulation of the common target gene EMX2 (empty spiracles homolog 2) and miR-3666 target PAX6 (paired box 6). The initial regional pattern of the neocortex is established by the distinct spatial distribution of PAX6 and EMX2.69 Additionally, model 2 (Figure 5B) demonstrates miR-3666 may enhance FOXP2 suppression of LMO4 (LIM domain-only 4) by inhibiting the common target gene, CREB1 (cAMP responsive element binding protein 1). LMO4 gene shows asymmetric expression in the embryonic human brain possibly due to repression by FOXP2 and hence plays important roles in cortical patterning.68 LMO4 is known to form a complex with CREB.80
Analysis of GSE2863323 revealed the expression changes of genes of models 1 and 2. Log2-transformed and median centered expression values were visualized as a heatmap using a color coded scale. FOXP2 shows relatively higher expression in neuroectodermal stage (NE) and in differentiated neurons (DN) and lower expression in human embryonic stem cells (hESCs). As expected, during differentiation, we see the upregulation of genes EFNB2, PAX6 and EMX2 in NE and SOX4 in DN (Figure 6). Besides regulating FOXP2 functions by binding to its targets, model 1 (Figure 5a) shows miR-3666 may also regulate the expression of FOXP2 itself. POU3F2 (POU class 3 homeobox 2, aka Brn-2) has been known to bind and activate FOXP2.81 Besides activating NEUROG2,82,83 PAX6 can also induce the expression of POU3F284 and FOXP2.85 Hence, we infer that miR-3666 can therefore regulate the expression of FOXP2 by regulating its targets, the FOXP2 activators PAX6 and POU3F2.
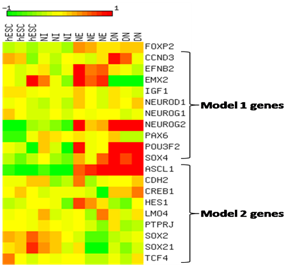
A color coded scale from 2 to 12 represents expression values where color intensity towards red corresponds to higher expression from median and color intensity towards green corresponds to lower expression from median expression value and yellow corresponds to median expression.
FOXP2 and miR-3666 may be responsible for the pathogenesis of schizophrenia
Schizophrenia (SCZ) is a severe and chronic neuropsychiatric disorder; it is reported to have a lifetime prevalence of approximately 1%.86 This neurodevelopmental disorder involves multiple genes that may be directly or indirectly modulated by FOXP2 and miR-3666. As model 3 (Figure 5C) shows, the candidate gene ERBB4 ,87 being a common target gene, may be directly regulated by miR-3666 and FOXP2. However, miR-3666 and FOXP2 can regulate the levels of candidate genes BDNF (Brain-Derived Neurotrophic Factor),88 DGCR2 (DiGeorge syndrome critical region gene 2).89 NRG160 through common target CREB1. This relation is evident from the GEO2R analysis of GSE1761290 expression data where upregulation of FOXP2 (log2FC= 0.54360366) and downregulation of BDNF (log2FC = -0.54217872) is observed in these cells (Figure 7). We assume the upregulation of FOXP2 may be responsible for low BDNF levels; FOXP2 and miR-3666 may indirectly repress BDNF by inhibition of CREB1. In the BDNF expression profile, one sample shows much higher expression level compared to the rest, which may be due to age-related differences or the use of anti-psychotic drugs.88,91,92 Moreover, FOXP2 probably directly inhibit DISC1 (Disrupted-In-Schizophrenia 1),93 whereas miR-3666 may indirectly inhibit it by repressing NDEL1 and hence disrupting DISC1-NDEL1 interaction.63
FOXP2 and miR-3666 may be responsible for the pathogenesis of autism and ASD
Autism and ASD are developmental disorders with three core symptoms: "deficits in social interactions and understanding; aberrant communication and/or language development; and restricted interests and repetitive, stereotyped behaviors".94 Autism candidate genes ERBB495 and BDNF96,97 have been associated with ASD. As shown in model 3 (Figure 5C). ERBB4 may be directly co-regulated by miR-3666 and FOXP2 since it is a common target; whereas BDNF levels may be indirectly regulated via common target CREB1. Therefore, these interactions have not been shown in model 4 (Figure 5D) again. FOXP1 (forkhead box protein P1) deletions98,99 and increase100 have both been associated with ASD. Both FOXP1101 and FOXP2 can downregulate CNTNAP2 (Contactin-associated protein-like 2),100,102 another candidate gene of ASD.67 Chien et al.100 hypothesized that enhanced FOXP1 expression can increase the expression of FOXP2 through a feedback mechanism, which in-turn may then lead to the reduction of CNTNAP2 levels and result in ASD. Hence, interactions among FOXP1, FOXP2 and CNTNAP2 genes may be responsible for the pathogenesis of syndromic and non-syndromic ASD.100 As model 4 (Figure 5D) shows, miR-3666 can play an "enemy" role to FOXP2 by repressing FOXP1 and removing its inhibitory effect on CNTNAP2 or it may inhibit FOXP1 expression and affect the modulatory roles of FOXP2 that requires FOXP1-FOXP2 dimerization. FOXP2 and miR-3666 can also jointly affect the levels of common targets MET (MET receptor tyrosine kinase), TCF4, SNAP25 (synaptosomal-associated protein of 25 kDa) and PTPN11, which are candidate genes for ASD.103-107 PAX6 regulation by miR-3666 is not only important to maintain the levels of FOXP2 but also to prevent the development of autism and related disorders, as PAX6 is also a candidate gene for ASD.108
Relations in above models are also supported by the transcriptomic expression data. GEO2R analysis of GSE38322109,110 revealed the upregulation of TCF4 (log2FC = 0.629) (Figure 8A) and downregulation of SNAP25 (log2FC = -0.828) (Figure 8B). GEO2R analysis of GSE29691 also revealed the upregulation of TCF4 (log2FC = 0.55079923) (Figure 8C) and downregulation of PTPN11 (log2FC = -0.53875346) (Figure 8D). Even though low levels of TCF4 has resulted in Pitt-Hopkins Syndrome (PHS),104,111 a disease related to autism with common symptoms, high levels of TCF4 has been observed in patients afflicted with SCZ.112,113 Since SCZ and autism are closely related, it may be deduced that high levels of TCF4 may lead to development of autism or related disorders. GEO2R analysis of GSE6575114 did not show any significant differential expression of our selected genes, however, driver gene analysis of GSE6575 (Figure 9) revealed significant (p<0.05) downregulation of CNTNAP2 and TCF4 but no up regulated genes. These observations are in concordance to our models' suggestion of the levels of candidate genes associated with the disorders. It is not surprising that the expression data used as evidence for autism candidate gene levels did not show differential expression of FOXP2 levels in autism patients. This may be due to the use of blood samples in the experiment related to GSE29691, as FOXP2 is not significantly expressed in blood.115 Also, since post-mortem brains are used, the expression may be too low for detection. A previous study attempted to measure the mRNA level of FOXP2 in lymphoblastoid cell lines using RT-qPCR, but the mRNA levels were too low to be detected.100
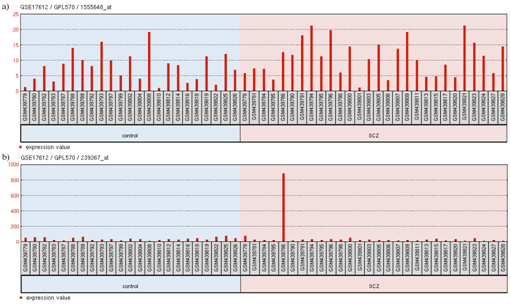
Figure 7 Expression profile of
(A) FOXP2 and
(B) BDNF in GSE17612.
The title shows GEO accession number (GSE17612), platform ID (GPL570) and the probe ID (1555648_at for FOXP2 and 239367_at for BDNF). The groups shown are (1) control and (2) SCZ (shizophrenia). Each group contains particular samples as designated by their GSM IDs. The red bars represent the expression measurement extracted from the MAS5.0 signal intensity values of the samples.
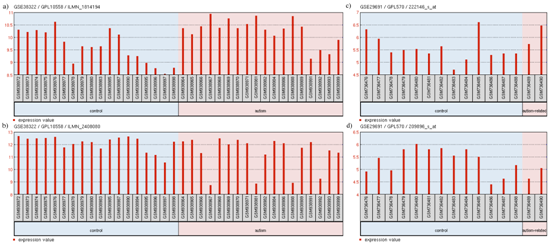
Figure 8 Expression profile of
(A) TCF4
(B) SNAP25 in GSE38322
(C) TCF4 and
(D) PTPN11 in GSE29691.
The profile diagram is titled in the fomat "GEO accession number/platform ID/probe ID". The groups shown are (1) control and (2) autism-related. Each group contains particular samples as designated by their GSM IDs. The red bars in GSE38322 represent the expression measurement extracted from the quantile normalized, variance stabilized, signal intensity values of the samples whereas the red bars in GSE29691 represent the expression measurement extracted from the Log2 GCRMA signal intensity values of the samples.

Figure 9 Heatmap of selected downregulated driver genes.
Driver gene analysis from GEO expression dataset GSE6575.P-value of significance as candidate driver gene is represented in a color coded scale in the heatmap. Color towards red indicates more significantly down regulated driver genes, whereas color towards yellow indicates less significantly downregulated genes and grey indicates non-significant genes. Our selected genes are highlighted in square box.
This study demonstrates that intronic miRNA, miR-3666 and its host gene, FOXP2, coincides with a functional relation in neurodevelopment, as deduced from literature mining, expression data analysis and functional enrichment analysis of the common target genes. Further literature mining and interaction studies show how miR-3666 may regulate FOXP2 functions as an "enemy" or "partner"; based on which four models were developed. Neurodevelopment being a complex biological process requires precise regulation; these models suggest mechanisms in which miR-3666 can modulate FOXP2 functions by directly or indirectly affecting the expression of FOXP2 target genes to ensure the precise spatial and temporal regulation of genes associated with neurodevelopment. The models also show how miR-3666 and FOXP2 may be associated with the neurodevelopmental disorders schizophrenia and autism. Microarray expression data were analyzed which support some interactions between FOXP2 and its targets as portrayed in the models. Further validation of these models by in vitro and in vivo experiments would help in the development of more effective stem cell therapies, which is especially attractive due to limited regenerative capacity of neurons in mammals.116 Besides stem-cell therapies, an understanding of the function of miR-3666 may be useful for the designing of miRNA-based therapeutics. For example, in our study we find that miR-3666 and FOXP2 inhibit MET expression. Since reduced MET levels in the brain have been associated with autism, anti-miR-3666 may be a potential drug to offset the inhibitory effects of FOXP2 and return MET to normal levels. Additionally, the results may be implicated in development of therapeutics against neurodevelopmental disorders.
We acknowledge the research grants from University Grants Commission (to Dhaka University). SMM was recipient of National Science and Technology Fellowship (grant ID:73) from Ministry of Science and Technology, Government of Bangladesh.
The author declares no conflict of interest.

©2017 Mostafa, et al. This is an open access article distributed under the terms of the, which permits unrestricted use, distribution, and build upon your work non-commercially.