Journal of
eISSN: 2572-8466


Research Article Volume 6 Issue 4
1Department of Biotechnology and Bioinformatics, California State University, USA
2Department of Biomedical Engineering, University of California Los Angeles, USA
Correspondence: Bill Tawil, Department of Bioengineering, UCLA School of Engineering, 420 Westwood Plaza, Room 5121, Engineering V. P.O. Box: 951600, Los Angeles, CA 90095-1600, USA, Fax (310) 794-5956
Received: May 19, 2019 | Published: July 17, 2019
Citation: Calixto V, Benjamin H, Shital P, et al. Effect of creatine and turmeric on muscle and non-muscle cells. J Appl Biotechnol Bioeng. 2019;6(4):160-169. DOI: 10.15406/jabb.2019.06.00189
Creatine is important for energy storage and is widely used as a supplement to improve muscle strength. Turmeric is a potential therapeutic agent, and used in the management of oxidative, and inflammatory conditions. There has been an immense interest in creatine and turmeric research over the years and they have been extensively studied. However, there have been no studies available on their combined effect at the cellular level. The purpose of this study was to investigate the individual and combined effects of creatine and turmeric on muscle and non-muscle (fibroblast) cells. The differential effect was observed on both cell line in the presence of creatine alone and turmeric alone treatment. When creatine and turmeric were tested separately, creatine increases the proliferation rate of muscle cells and decreases proliferation rate of non-muscle cells at tested concentrations (3.25µg/mL, 32.5µg/mL, and 325µg/mL). On the other hand, turmeric increases the proliferation rate of non-muscle cells compared to muscle cells at tested concentrations (4.62µg/mL, 23.1µg/mL, and 46.2µg/mL). Non-muscle cells showed a decreased proliferation with creatine (325µg/mL) and increased proliferation with turmeric (46.2µg/mL) at maximum tested concentrations. Hence, for testing their combined effect on both cell lines higher concentrations (650µg/mL and 925µg/mL) were used. The combined concentrations of creatine and turmeric at 650µg/mL and 925µg/mL did not show a significant effect on muscle cells. However, the same concentrations increased the proliferation of non-muscle (fibroblast) cells compared to muscle cells. Although creatine alone or turmeric by itself was found to be more effective on the proliferation of non-muscle cells than combining both of them together. The results of this study suggest that creatine and turmeric supplementation together may not be beneficial for post-workout recovery. However, both of them together may be used in skin cosmetics formulation to improve skin cells.
Keywords: human foreskin fibroblasts, L6 muscle, anti-inflammatory, antioxidant, ATP generation
FBS, fetal bovine serum; ATP, adenosine triphosphate; PBS, phosphate buffer saline each time; ECM, extracellular matrix; HFF-1, human foreskin fibroblasts.
There has been an immense interest in creatine and turmeric research over the years and they have been widely studied. Creatine is important for energy storage, Adenosine triphosphate (ATP) generation and also acts as an antioxidant.1–3 It is widely used as a supplement to improve muscle strength.4 The main purpose of creatine supplementation is to increase the resting phosphocreatine levels in muscles which could potentially delay fatigue and enhance physical activity.5 In muscles, creatine generally exists as phosphocreatine and is excreted in the form of creatinine.6 Around ninety-five percent of creatine is stored in skeletal muscle and serves as an energy substrate for muscle cells contraction.5 Turmeric is the main natural polyphenol found in the rhizome of Curcuma longa.7 It is a spice that has long been recognized for its medicinal properties.8 It also has antioxidant and anti-inflammatory properties. The medicinal properties of turmeric are attributed to its ability to enhance tissue formation, collagen deposition, tissue remodeling, and wound contraction.7– 9 Individual effect of creatine and turmeric has been widely examined on a variety of cell lines.10–12 No known studies are available to compare the combined effect of turmeric and creatine on non-muscle and muscle cell lines. In this study, we have examined the separate and combined effect of creatine and turmeric in an in-vitro matrix on muscle and non-muscle (fibroblast) cell lines. Human foreskin fibroblast (HFF-1) cells were used as non-muscle cell and L6 myoblast cells were used as muscle cells.
HFF-1 cells are derived from new-born humans and are grown in fetal bovine serum (FBS) media.13 Fibroblast cells occur in connective tissue of animals and synthesizes the extracellular matrix (ECM) which is made of growth factors and proteins that directly affect the differentiation, proliferation, and migration of cells.14 Fibroblasts cells are spindle-shaped, anchorage-dependent, members of the connective tissue family. They secrete type I and III collagen into the ECM and play an important role in wound healing and immune response during tissue injury.15 Fibroblasts bind directly to fibronectin fibrils which subsequently attach to collagen scaffolds which in turn provide structure, support, growth, and communication.14,16 L6 myoblast cells are from the skeletal muscle tissue and originate from Rattus norvegicus otherwise known as the “brown rat”. L6 muscle cells are adherent and have a cellular product of myosin.17,18 L6 cells fuse in culture to create striated fibers and multinucleated myotubes.19 Muscle cells are found in muscle tissue and are long, tubular cells which develop from myoblasts to form muscles by the process of myogenesis.20 There are various types of muscle cells like cardiac, skeletal, and smooth muscle cells and each one has specialized properties.20,21 Muscle cell plays an important role in providing movement, motion, and heat generation to various organs of the body.22 In this study, both muscle and non-muscle cell lines displayed variable rates of proliferation when treated with different concentrations of creatine and turmeric for a period of seven days.
HFF-1 and L6 -muscle cell culture
HFF-1 and L6-muscle cell solutions (ATCC, Manassas, VA, USA) were prepared separately in T 75 flasks (Thermo ScientificTM, Waltham, MA, USA) and stored in an incubator (Thermo ScientificTM, Waltham, MA, USA) at 37°C and 5% CO₂. After confirmation of appropriate confluency via phase contrast microscope CKX41 (Olympus®️, Shinjuku, Tokyo, Japan), existing media from the HFF-1 cells was removed. Cells were washed twice with 5mL of phosphate buffer saline each time (PBS) (GE Healthcare, Chicago, IL, USA) and subsequently removed. Trypsinization of cells was performed by the addition of 5mL of trypsin (GE Healthcare, Chicago, IL, USA), the cells were allowed to rest for 10minutes at room temperature to allow them to detach from the surface of the flask. The flask was then examined under the phase contrast microscope to confirm the detachment of cells from the flask surface. For L6 muscle cells, a similar procedure was performed with L6 muscle cell media. To stop trypsin activity, 5mL of media with serum was added to the flask. The total suspension of 10mL was placed into a 15mL conical centrifuge tube (Fisherbrand, Waltham, MA, USA) and subjected to centrifugation in a centrifuge (Eppendorf AG, Hamburg, Germany) at 200rpm for 5minutes. The supernatant was then removed and the remaining pellet was re-suspended in 1mL of HFF-1 or L6 muscle media. 20μL of the cell solution was added to a cellometer cell counting chamber (Nexcelom Bioscience, Lawrence, MA, USA) and cell density was measured by the Cellometer Auto T4 (Nexcelom Bioscience, Lawrence, MA, USA) and average live cell concentration was calculated. Cell proliferation assays on the 2D matrix were performed at different concentrations of creatine (Sigma-Aldrich®️, St. Louis, MO, USA) and turmeric (Finest Nutrition, Deerfield, IL, USA) for both muscle and non-muscle cells.
2D HFF-1 cell proliferation assay
Collagen and fibronectin
Three 24-well plates (Corning Incorporated, Corning, NY, USA) were coated with either collagen (5µg/mL), collagen (10µg/mL), fibronectin (5µg/mL), or fibronectin (10µg/mL) as an extracellular matrix (Sigma-Aldrich®️, St. Louis, MO, USA). HFF-1 cells with an initial cell density of 10,000 per well were seeded in a 24 well culture cluster; grown in HFF-1 media and incubated at 37°C, 5% CO₂ inside the incubator for day 1, day 4 and day 7.
Different concentrations of creatine
Creatine stock solution was created in hff-1 media and filtered through Nalgene™ 25mm Syringe Filters (Thermo ScientificTM, Waltham, MA, USA). 3.25µg/mL (1X), 32.5µg/mL (10X) and 325µg/mL (100X) concentrations of creatine were created from standard stock by serial dilution method and pH of each solution was measured. HFF-1 cells with an initial cell density of 10,000 per well were seeded in 24 well culture cluster coated with 10µg/mL collagen and grown in HFF-1 media. All three plates for day 1, day 4 and day 7 were prepared by the same method and placed inside the incubator at 37°C with 5% CO₂.
Different concentrations of turmeric
Turmeric is soluble in dimethylsulfoxide (DMSO) and hence turmeric stock solution was created in 1.5% DMSO with media¹² and filtered through Nalgene™ 25mm Syringe Filters (Thermo ScientificTM, Waltham, MA, USA). 4.62µg/mL (1X), 23.12µg/mL (5X) and 46.2µg/mL (10X) concentrations of turmeric were created from standard stock by serial dilution method and pH of each solution was measured. For the control, an adequate amount of DMSO as a vehicle was added in the media. The final concentration of DMSO to the cells is less than 0.5%. HFF-1 cells with an initial cell density of 10,000 per well were seeded in 24 well culture cluster pre-coated with 10µg/mL of collagen and grown in HFF-1 media then incubated at 37°C, 5% CO₂ inside the incubator. Three plates were prepared by the same method and placed inside the incubator for day 1, day 4 and day 7.
Creatine and turmeric combined effect
HFF-1 cells with an initial cell density of 10,000 cells per well were seeded in 24 well culture cluster coated with 10µg/mL collagen and treated with either 650µg/mL creatine, 92.5µg/mL turmeric, their combined concentrations or with just HFF-1 media. 1.5% of DMSO was used as a vehicle to dissolve turmeric and hence an equal amount of DMSO was added to each experimental and control condition.Three plates were prepared by the same method and placed inside the incubator at 37°C with 5% CO₂ to be analyzed for initial adhesion on day 1, after one hour of incubation, and cell proliferation on days 4 and 7.
2D L6 muscle cell proliferation assay
Different concentrations of creatine
L6 muscle cells with an initial cell density of 10,000 cells per well were seeded in 24 well culture cluster pre-coated with 10µg/mL collagen and treated with either 3.25µg/mL (1X), 32.5µg/mL (10X), 325µg/mL (100X) concentrations of creatine, or just L6 Muscle cell media and incubated at 37°C, 5% CO₂. Three plates were prepared by the same method and placed inside the incubator to be analyzed for initial adhesion on day 1, after one hour of incubation, and cell proliferation on days 4 and 7.
Different concentrations of turmeric
4.62µg/mL, 23.12µg/mL and 46.2µg/mL concentrations of turmeric were created from the standard stock of turmeric solution. Turmeric standard stock solution was prepared with 1.5% of DMSO and L6 media. L6 muscle cells with an initial cell density of 10,000 per well were seeded in 24 well culture cluster plate pre-coated with 10µg/mL collagen and treated with either 4.62µg/mL, 23.12µg/mL, 46.2µg/mL concentrations of turmeric, or with the control.Three plates were prepared by the same method and placed inside an incubator at 37°C, 5% CO₂ to be analyzed for initial adhesion on day 1, after one hour of incubation, and cell proliferation on days 4 and 7.
Different concentrations of creatine and turmeric
L6 muscle cells with an initial cell density of 10,000 per well were seeded in 24 well cell culture cluster plate coated with 10µg/mL collagen and treated with either 650µg/mL creatine, 92.5µg/mL turmeric, their combined concentrations (650µg/mL creatine with 92.5µg/mL turmeric) or with just L6 media (Blank). Three plates were prepared by the same method and placed inside an incubator at 37°C, 5% CO₂ to be analyzed for initial adhesion on day 1, after one hour of incubation, and cell proliferation on days 4 and 7.
HFF-1 and L6 muscle cell analysis
HFF-1 and L6 muscle cells were analyzed by fluorescent staining with calcein to measure the rate of initial adhesion on day 1 and the rate of cell proliferation on days 4 and 7. On day 1 after one hour of incubation, two washes were given to the plate by the addition of 0.5mL of PBS per well and subsequently removed. A calcein solution consisting of a ratio of 10µL of calcein-AM (Life Technologies, Carlsbad, CA, USA) and 5mL of PBS was prepared and used to perform fluorescent staining to obtain a live cell count. 200µL of calcein solution was added into each well and incubated for a period of 15 minutes in a dark drawer. Cell proliferation was measured by using a Filtermax F5 Microplate Reader (Molecular Devices, San Jose, CA, USA) and data was calculated on Microsoft Excel and graphs were created using GraphPad Prism software. Fluorescent images were captured under a fluorescent microscope 1X71 with a Cy3 filter (Olympus®️, Shinjuku, Tokyo, Japan) at 100x and 40x magnification. The exact same procedure was used on days 4 and 7 plates to measure live cell concentration and analyzed by the same method.
Statistical analysis
The statistical analysis of the data was presented with the mean±standard deviation (sd). A paired student t-test was used between the study groups to determine the significance of observed differences. A p-value of <0.05 is considered statistically significant.
Effect of collagen and fibronectin matrix on HFF-1 Cells
The initial adhesion rate was determined after one hour of incubation by measuring the number of cells attached to the surface of either collagen (5µg/mL), collagen (10µg/mL), fibronectin (5µg/mL), or fibronectin (10µg/mL). Initial adhesion was compared between conditions on day 1 after one hour of incubation. Rate of proliferation for the cells was examined on days 4 and 7 and compared to the condition with control. Day 7 test conditions were compared to the day 7 condition with control for statistical significance. Fluorescent staining with calcein was performed to study cell morphology on days 1, 4 and 7.
HFF-1 cells with an initial density of 10,000 per well were seeded onto four separate conditions with either collagen (5µg/mL), collagen (10µg/mL), fibronectin (5µg/mL), or fibronectin (10µg/mL). This was an essential step in order to establish which matrix is most suitable for testing the effects of turmeric and creatine. HFF-1 cells that were seeded on the substrate of fibronectin (5µg/mL) displayed the most initial adhesion. The condition which showed the second greatest amount of initial adhesion for HFF-1 cells was fibronectin (10µg/mL). The condition of collagen (5µg/mL) had the third best initial adhesion. Finally, collagen (10µg/mL) condition had the least amount of initial adhesion for HFF-1 cells.
HFF-1 cell proliferation was measured on days 4 and 7. Each condition followed the same trend and on each subsequent day there were more HFF-1 cells present than on the previous day, in Figure 1A. HFF-1 cells which were grown on fibronectin (5µg/mL) had the least amount of proliferation over the seven days period. This was followed by the fibronectin (10µg/mL) condition which had the third best proliferation over the same time period. Overall, the cells which were seeded onto the collagen conditions proliferated better when compared to the fibronectin. Collagen with a concentration of 5µg/mL had the second-best proliferation results out of the four test conditions. Lastly, the condition which had collagen with a concentration of (10µg/mL) provided the best environment for HFF-1 cells to proliferate (Figure 1B).

Figure 1A HFF-1 cells were seeded on substrates of either collagen (5µg/mL), collagen (10µg/mL), fibronectin (5µg/mL), or fibronectin (10µg/mL) and grown over seven days. Cellular growth was measured on days 1, 4, and 7 with a calcein treatment and read using a FilterMax F5 Microplate Reader.
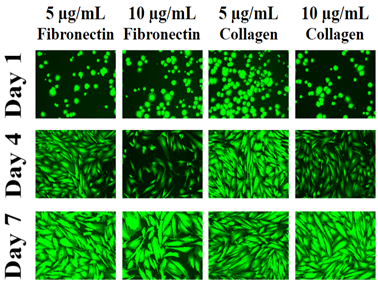
Figure 1B Images were taken at 10x magnification using a Olympus® 1X71 fluorescent microscope and Cy3 filter. The statistical analysis on the data was presented with the mean±standard deviation (SD). A Paired Student t-Test was used between the study groups to determine significance of observed differences. A p-value of <0.05 is considered statistically significant.
Figure 1 Effect of Fibronectin and Collagen on HFF-1 Cells.
The morphology for the HFF-1 cells was consistent across all conditions. On day 1, HFF-1 cells appear to be round in shape with some displaying a slightly ruffled edge. Next, on day 4 the cells are more numerous and elongated in shape when compared to day 1 cells. Day 7 HFF-1 cells were similar in shape to day 4 but they appear to be greater in number when compared to day 4. In addition the day 7 HFF-1 cells look to be wider in shape when compared to the day 4 cells.
After examining which substrate provided the best environment for cells, it was found that collagen (10µg/mL) allowed for the most proliferation over a seven day period while fibronectin (5µg/mL) conditions had the most initial adhesion. There was little to no noticeable difference in morphology for the cells between conditions seen.
Effect of creatine on fibroblast and L6 muscle cells
Effect of various concentrations of creatine on HFF-1 cells
The rate of initial adhesion of HFF-1 cells was examined on day 1 after one hour of incubation. Creatine concentrations of either 3.25µg/mL, 32.5µg/mL or 325µg/mL were used as treatments on 24 well plate pre-coated with 10µg/mL collagen. An initial density of 10,000 cells per well were seeded on 24 well plates. Cell proliferation was measured on days 4 and 7. Day 7 proliferation results of the test conditions were compared to day 7 of the treatment with the control condition. Fluorescent staining with calcein was performed on different days and images of cells were captured under a fluorescent microscope to compare the morphology of cells.
Initial adhesion on day 1 was examined after one hour of incubation and it confirmed the presence of cells. The control condition had the lowest rate of initial adhesion hence it was used as a reference point with a numerical value of 100% to compare to the other experimental conditions. Creatine concentration of 3.25µg/mL had the greatest rate of initial adhesion (144%) on HFF-1 cells whereas 325µg/mL concentration showed the lowest rate (123%) of initial adhesion compared to the control. The 32.5µg/mL concentration of creatine had almost the same rate of initial adhesion (126%) with 325µg/mL concentration of creatine. All P-values were found to be statistically non-significant (P>0.05). Although there is an observed increasing trend in the rate of cell initial adhesion in the presence of lower concentrations of creatine. Figure 2A shows the results for the proliferation of HFF-1 cells. Cell proliferation is expressed as a percentage of the number of cells present on day 1 (100%) therefore day 4, and day 7 are expressed as a percentage of the number of cells present compared to day 1. As shown in Figure 2A, the control showed the highest rate of cell proliferation among all the conditions. However, cells treated with 3.25µg/mL, 32.5µg/mL and 325µg/mL concentrations of creatine decreased in proliferation when compared to media condition. 3.25µg/mL concentration of creatine had the lowest rate of cell proliferation over the seven days amongst all test conditions. 32.5µg/mL had the highest proliferation rate between all creatine conditions. 325µg/mL concentration of creatine had cell proliferation rate between 3.25µg/mL and 32.5µg/mL test condition. The morphology of HFF-1 cells can be seen in Figure 2B. On day 1, HFF-1 cells appeared to be round in shape and show a similar size and number between all test conditions.
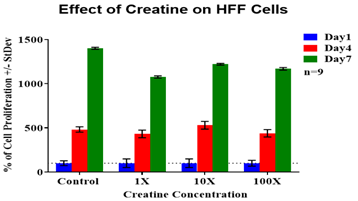
Figure 2A HFF-1 cells were seeded at an initial density of 10,000 per well in concentrations of either creatine (3.25µg/mL, 1X), creatine (32.5µg/mL, 10X) or creatine (325µg/mL, 100X) for seven days in an incubator at 37℃ with 5% CO₂. On day 1, after an hour of incubation, day 4, and day 7 measurements of proliferation were taken. During those reading, cells were treated with calcein and analyzed using a FilterMax F5 Microplate Reader.
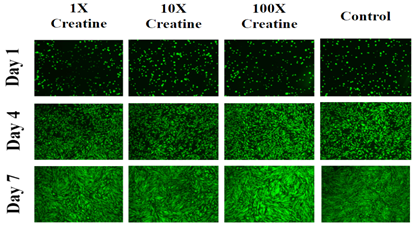
Figure 2B Images were taken of HFF-1 cells at 4x magnification using a Olympus® 1X71 fluorescent microscope and Cy3 filter.
On day 4, the HFF-1 cells were spreading on the matrix and become elongated and flattened in shape however, it was more numerous when compared to day 1. The 32.5µg/mL condition of creatine on day 4 looks more confluent compared to all other test conditions. On day 7, the cells appear to spread across the entire matrix, they are more elongated or oblong in shape and are more confluent compared to day 4. The control condition on day 7, it was more densely packed compared to all other test conditions.
Overall, the results of initial adhesion confirmed the presence of cells on day 1. HFF-1 cells showed a higher rate of initial adhesion in the presence of creatine. On the other hand, cell proliferation decreased in the presence of creatine. Cell morphology is nearly identical between different conditions on each day. The primary difference seems to be the number of cells present is greater in some conditions and less in others. Cells in the presence of creatine are less confluent on day 7 when compared to the control. The results showed that creatine decreases proliferation for HFF cells but increases initial adhesion. Cell morphology is not greatly influenced by creatine but does seem to affect the number of cells present.
Effect of creatine on L6 cells
Cells were incubated on plates coated with 10µg/mL of collagen. The rate of initial adhesion for L6 muscle cells treated with either 3.25µg/mL, 32.5µg/mL or 325µg/mL concentrations of creatine were measured on day 1 after one hour of incubation. The rate of cell proliferation was measured on days 4 and 7 and compared to its own day 1. Statistical analysis was used to compare the proliferation results between the day 7 conditions. The images of cells were captured using a fluorescent microscope and cell morphology was compared between different test conditions on different days.
The 325µg/mL concentration of creatine had the lowest rate of initial adhesion so it was used as 100% to compare to the other experimental conditions. The 32.5µg/mL creatine concentration had the greatest rate of initial adhesion (205%) which is slightly higher than control (194%). The 3.25µg/mL concentration of creatine (112%) had an almost similar rate of initial adhesion with 325µg/mL (100%) concentration of creatine. Figure 2C represents the rate of cell proliferation for L6 muscle cells on day 4 and day 7 compared to day 1. Cell proliferation is expressed as a percentage of the number of cells present on day 1 (100%) therefore day 4, and day 7 is expressed as a percentage of the number of cells present compared to day 1. The 325µg/mL concentration of creatine, had the highest proliferation rate compared to the other experimental conditions followed by the 3.25µg/mL concentration of creatine. 32.5µg/mL concentrations of creatine had the lowest rate of proliferation when compared to the other experimental conditions of creatine but more than the control. L6 muscle cells grown in the control condition displayed the lowest rate of cell proliferation among all test conditions. Figure 2D represents the morphology of L6 muscle cells. On day 1, cells on different experimental conditions look round in shape and cells in media condition and at 32.5µg/mL concentrations of creatine appear to be more in number when compared to other test conditions. On day 4, cells were more elongated, spindle-shaped and numerous when compared to day 1. Cells in the presence of creatine conditions look more confluent compared to media condition. On day 7, cells appear to be wider in appearance when compared to day 4. Cells with 3.25µg/mL and 325µg/mL concentrations of creatine are more confluent compared to media condition.
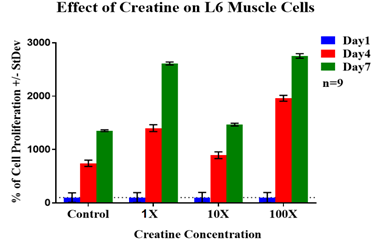
Figure 2C L6 cells were seeded at an initial density of 10,000 per well in concentrations of either creatine (3.25µg/mL), creatine (32.5µg/mL) or creatine (325µg/mL) for seven days in an incubator at 37℃ with 5% CO₂. On day 1, after an hour of incubation, day 4, and day 7 measurements of proliferation were taken. During those reading, cells were treated with calcein and analyzed using a FilterMax F5 Microplate Reader.
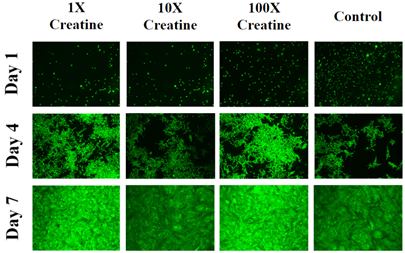
Figure 2D Images were taken of L6 cells at 4x magnification using a Olympus® 1X71 fluorescent microscope and Cy3 filter. The statistical analysis on the data was presented with the mean±standard deviation (SD). A Paired Student t-Test was used between the study groups to determine significance of observed differences. A p-value of <0.05 is considered statistically significant.
Figure 2 Effect of Creatine on HFF-1 and L6 Cells.
Overall, the results of initial adhesion confirmed the presence of L6 muscle cells on day 1. For certain conditions, the presence of creatine decreases the rate of initial adhesion whereas for some conditions it increases. Although there was no trend observed between creatine concentrations and the rate of initial adhesion. The results of cell proliferation showed L6 muscle cells exhibited an increase in the rate of cell proliferation in the presence of creatine. Cell morphology images confirmed that on day 4 and day 7, cells proliferate more and become more numerous when compared to day 1 and reach confluency on day 7.
Effect of turmeric on fibroblast and L6 muscle cells
Effect of turmeric on fibroblast cells
Initial adhesion at which cells attach to the surface of the well was measured on day 1 after one hour of incubation with different concentrations of turmeric. The HFF-1 cells at an initial density of 10,000 cells per well were seeded onto collagen-coated (10µg/mL) plate. Cell proliferation with different concentrations of turmeric was measured on day 4 and day 7 and compared to day 1. Fluorescent staining with calcein was performed on days 1, 4 and 7 plates to analyze the data and morphology of cells. This analysis was then used to compare the results obtained on different days within different test conditions.
The control showed the highest rate of initial adhesion (135%) whereas 4.62µg/mL and 23.1µg/mL concentration of turmeric showed the lowest rate of initial adhesion (102%, 100%). 46.2µg/mL concentration of turmeric had the second highest amount (115%) of initial adhesion. It can be seen that in the presence of turmeric there is a decreased trend of initial adhesion compared to control. The P-value is greater than 0.05 and there is a larger standard deviation bar for initial adhesion results also none are statistically significant. Figure 3A represents the rate of cell proliferation for HFF cells with different concentrations of turmeric. The control showed the lowest rate of cell proliferation whereas all other experimental conditions in the presence of turmeric showed increase in the rate of cell proliferation on day 4 and day 7. The 4.62µg/mL concentration of turmeric showed the highest rate of HFF-1 cell proliferation on day 7 this was followed by 23.1µg/mL concentrations of turmeric. 46.2µg/mL concentrations of turmeric showed a decrease in the rate of cell proliferation compared to 4.62µg/mL and 23.1µg/mL concentrations of turmeric. There is an increasing trend of proliferation between the presence of turmeric and HFF-1.
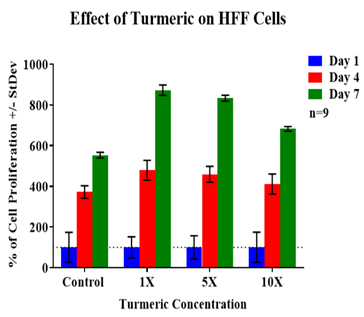
Figure 3A HFF-1 cells were seeded at an initial density of 10,000 per well in concentrations of either turmeric (4.6µg/mL, 1X), turmeric (23.1µg/mL, 5X), or turmeric (46.2µg/mL, 10X) for seven days in an incubator at 37℃ with 5% CO₂. On day 1, after an hour of incubation, day 4, and day 7 measurements of proliferation were taken. During those reading, cells were treated with calcein and analyzed using a FilterMax F5 Microplate Reader.
Overall, the results of initial adhesion confirmed the presence of cells on day 1. It was observed for HFF -1 cells, in the presence of turmeric, rate of initial adhesion decreases and cell proliferation rate increases. On day 1, cells appeared to be round in shape and on days 4 and 7 they become oblong and elongated in shape and were more numerous when compared to day 1 (Figure 3B).
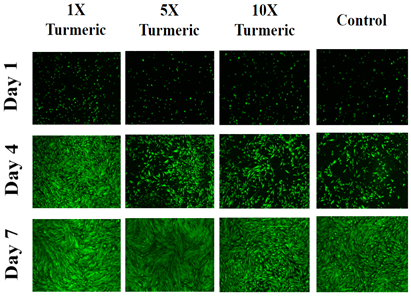
Figure 3B Images were taken of HFF-1 cells at 4x magnification using a Olympus® 1X71 fluorescent microscope and Cy3 filter.
Effect of turmeric on L6 muscle cells
The rate of initial adhesion was examined first. Cells were seeded with an initial density of 10,000 cells per well with different concentrations of turmeric on 24 well plate coated with collagen (10µg/mL). Cell proliferation was examined on days 4 and 7 and then compared to day 1. Calcein-AM staining was performed on HFF-1 cells on days 1, 4 and 7 to study the morphology of cells.
From initial adhesion, it was observed that the control displayed the lowest rate of initial adhesion among all other test conditions and hence it was considered as 100%. 4.62µg/mL and 23.1µg/mL turmeric concentration showed similar rate of initial adhesion (122%, 123%). The 46.2µg/mL turmeric concentration showed 107% of initial adhesion. An increasing trend of adhesion was observed between the presence of turmeric and L6 muscle cells. Figure 3C shows the results of L6 cell proliferation. Cell proliferation is expressed as a percentage of the number of cells present on day 1 (100%) and therefore days 4 and 7 are expressed as a percentage of the number of cells present compared to day 1. The 23.1µg/mL turmeric concentration showed the highest rate of cell proliferation among all experimental conditions followed by 46.2µg/mL concentration of turmeric. 4.62µg/mL concentration of turmeric showed the lowest rate of cell proliferation among all experimental conditions. The control showed a slightly higher rate of proliferation compared to 4.62µg/mL concentration of turmeric but still lower than 46.2µg/mL and 23.1µg/mL concentrations.
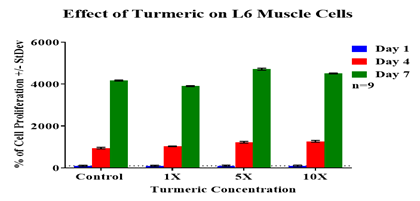
Figure 3C L6 cells were seeded at an initial density of 10,000 per well in concentrations of either turmeric (4.6µg/mL), turmeric (23.1µg/mL), or turmeric (46.2µg/mL) for seven days in an incubator at 37℃ with 5% CO₂. On day 1, after an hour of incubation, day 4, and day 7 measurements of proliferation were taken. During those reading, cells were treated with calcein and analyzed using a FilterMax F5 Microplate Reader.
Cell morphology for L6 muscle cells is seen in Figure 3D. L6 muscle cells on day 1 appear circular and a showed a similar size to other cells observed at all test conditions. Cell images on day 1 appear nearly similar in shape when compared to different test conditions. Day 4 and day 7 images of cells at 23.1µg/mL and 46.2µg/mL condition appear more confluent compared to the other two conditions which reflect the results of cell proliferation from Figure 3C. A spindle-like shape for the cells is observed on day 4 and day 7. Day 7 cells are elongated in shape like day 4 but appear to have empty spots present.
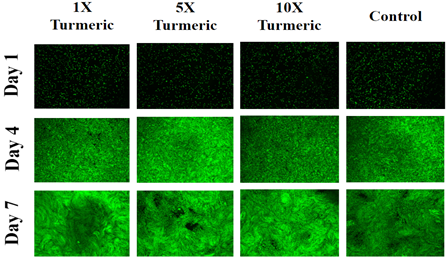
Figure 3D Images were taken of L6 cells at 4x magnification using a Olympus® 1X71 fluorescent microscope and Cy3 filter. The statistical analysis on the data was presented with the mean±standard deviation (SD). A Paired Student t-Test was used between the study groups to determine significance of observed differences. A p-value of <0.05 is considered statistically significant.
Figure 3 Effect of Turmeric on HFF-1 and L6 Cells.
Overall, the results of the experiment suggested that L6 muscle cells exhibited a higher rate of initial adhesion in the presence of turmeric. There was no trend observed between the presence of turmeric and L6 muscle cells proliferation rate. The fluorescent images of cells reinforced that cell proliferation rate was increasing at higher concentrations of turmeric and it was decreasing at lower concentrations of turmeric when compared to the control.
Combined effect of creatine and turmeric on HFF-1 and L6 muscle cells
Combined effect of creatine and turmeric on HFF-1 cells
At first, the rate of initial adhesion was examined on day 1 after one hour of incubation. HFF-1 cells were seeded with an initial density of 10,000 cells per well with different concentrations of either creatine, turmeric, or both components combined. The cell proliferation was examined on days 4 and 7 and compared to day 1. Calcein-AM staining was performed on HFF-1 cells on days 1, 4 and 7 to study the morphology of cells.
The initial adhesion is compared from day 1 data between different test conditions to the lowest initial adhesion percentage which was observed in 92.5µg/mL of turmeric. 92.5µg/mL of turmeric initial adhesion was considered as 100% for comparison between different test conditions. The 650µg/mL creatine combined with 92.5µg/mL turmeric showed the highest rate of initial adhesion (140%). 650µg/mL creatine and 92.5µg/mL of turmeric when treated separately have a similar rate of initial adhesion (102%, 100%). The control showed 111% of initial adhesion. Creatine or turmeric when treated separately, had their initial adhesion decrease whereas when both of them were combined together, the rate of initial adhesion increases for HFF-1 cells. Figure 4A shows the results of cell proliferation for HFF-1 cells on 24 well plates initially coated with collagen. Cells were seeded with either regular media or in different concentration of creatine, turmeric, or both combined and observed at days 1, 4, and 7. The control shows the lowest rate of cell proliferation among all conditions. The 650µg/mL of creatine had the highest rate of cell proliferation followed by 92.5µg/mL concentration of turmeric. The 650µg/mL creatine and 92.5µg/mL turmeric together showed a lower rate of proliferation than the individual effect of creatine and turmeric. The day 7 results of different test conditions to were compared day 7 of the control. The P-value was < 0.05 indicating that HFF-1 cell has lower proliferation at a combined concentration of creatine and turmeric and is lower than creatine alone or turmeric alone. Fluorescent staining with calcein was performed on days 1, 4 and 7 to study the morphology of cells. On day 1, cells appear round in shape and almost similar in number between different test conditions. On day 7, cells were more confluent, elongated and oblong in shape. On days 4 and 7, cells treated with just creatine or turmeric alone looks more confluent than combined treatment. Cells also look more flattened and showed a granular appearance. Overall, combining creatine and turmeric together increased initial adhesion and decreases cell proliferation rate of HFF-1 cells when compared to individual treatment of creatine or turmeric. Creatine treatment by itself is more effective than turmeric alone in increasing the proliferation of HFF-1 cells (Figure 4B).
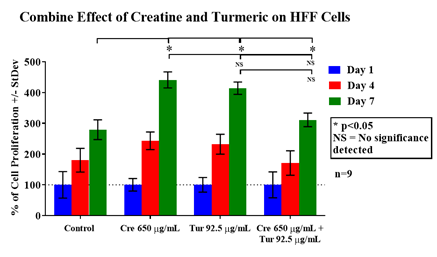
Figure 4A HFF-1 cells were seeded at an initial density of 10,000 per well in concentrations of either creatine (650µg/mL), turmeric (92.5µg/mL), or both components combined (650µg/mL + 92.5µg/mL) for seven days in an incubator at 37℃ with 5% CO₂. On day 1, after an hour of incubation, day 4, and day 7 measurements of proliferation were taken. During those reading, cells were treated with calcein and analyzed using a FilterMax F5 Microplate Reader.
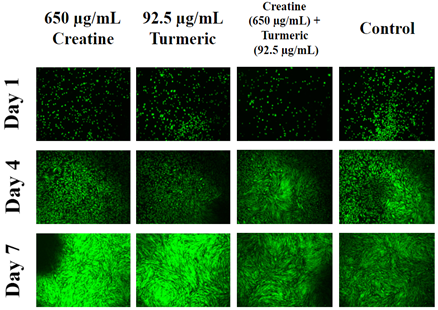
Figure 4B Images were taken of HFF-1 cells at 4x magnification using a Olympus® 1X71 fluorescent microscope and Cy3 filter.
Combined effects of turmeric and creatine on L6 muscle cells
Initial adhesion, proliferation, and morphology results were examined for L6 muscle cells. For initial adhesion, the data were obtained on day 1 one hour of incubation. Later on days 4 and 7, proliferation data were collected using a calcein treatment and read with a microplate reader. The calcein treatment also allowed for images to be taken on days 1, 4, and 7 of living cells (Figure 4C).
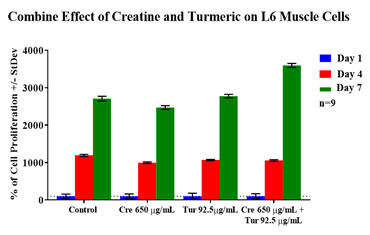
Figure 4C L6 cells were seeded at an initial density of 10,000 per well in concentrations of either creatine (650µg/mL), turmeric (92.5µg/mL), or both components combined (650µg/mL + 92.5µg/mL)for seven days in an incubator at 37℃ with 5% CO₂. On day 1, after an hour of incubation, day 4, and day 7 measurements of proliferation were taken. During those reading, cells were treated with calcein and analyzed using a FilterMax F5 Microplate Reader.
It was observed that the control had the lowest initial adhesion (100%) and 650µg/mL concentration of creatine had the highest (186%) rate of initial adhesion among all experimental conditions. The 92.5µg/mL concentration of turmeric had the second highest (155%) rate of initial adhesion. Whereas the combined treatment of 650µg/mL of creatine with 92.5µg/mL of turmeric had the lowest (114%) amount of initial adhesion amongst all the test conditions. Cell proliferation can be seen in Figure 4D, creatine (650µg/mL) with turmeric (92.5µg/mL) had the highest rate of cell proliferation. The control and 92.5µg/mL treatment of turmeric had a very similar amount of proliferation. While the 650µg/mL concentration of creatine had the lowest rate of proliferation for the period of seven days. Cell morphology was very similar across all conditions for day 1. On day 1, the cells were circular in shape. On day 4, the cells began to have a more elongated shape and were more numerous when compared to day 1 cells. Combined treatment of creatine with turmeric looks more confluent on day 7 compared to all other test conditions. Day 7 cells are similar in shape to day 4 but are even more numerous.
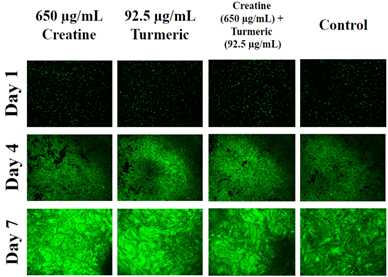
Figure 4D Images were taken of L6 cells at 4x magnification using a Olympus® 1X71 fluorescent microscope and Cy3 filter. The statistical analysis on the data was presented with the mean±standard deviation (SD). A Paired Student t-Test was used between the study groups to determine significance of observed differences. A p-value of <0.05 is considered statistically significant.
Figure 4 Effect of Turmeric, Creatine, and Both Combined on HFF-1 and L6 Cells.
The results for initial adhesion showed that the combined treatment of creatine and turmeric for L6 muscle cells allowed for less initial adhesion than these individual components by themselves. The creatine and turmeric by themselves allowed for more initial adhesion. Cell proliferation for L6 cells shows increased in proliferation in the presence of creatine with turmeric (combined treatment) and decreased in proliferation when treated separately. Cell morphology was similar amongst all conditions and the control on day 1 but cells look more confluent on day 7 for combined treatment.
Creatine and turmeric are used for different purposes and their use as an oral supplement is growing remarkably.23,24 It has been proven that creatine has multiple properties, it improves energy performance and also acts as an antioxidant.25,26 Turmeric has anti-inflammatory and antioxidant properties. 8,9,27 Creatine and turmeric are also used in skin cosmetics for topical formulations.28,29 One of the recent research study indicated that the topical formulation of folic acid and creatine appears to be a viable treatment option for the treatment of photo-damaged skin.30
Creatine and turmeric are an active area of research and most of the research studies are focused on their medicinal and therapeutic properties either in human or animal models.31– 33 It is equally important to perform in vitro studies of these supplements at a cellular level before using them in animal models or in clinical trials. In this study, we have examined the effects of creatine and turmeric separately and in combination on muscle (L6) and non-muscle (HFF-1) cells. Creatine is a popular and well-researched supplement mostly used during exercise.2 Turmeric may also help in the management of inflammation-induced after exercise and can also improve recovery and exercise performance.8
Most people take creatine and turmeric as separate supplements without knowing their health benefit and hence the researchers were interested to check the separate and combined impact of these two on muscle and non-muscle cells performance. Initially, for this study, collagen or fibronectin was tested as a matrix to better understand how fibroblast (non-muscle) cells interact with the ECM through integrins. Collagen at a concentration of 10µg/mL provided a better environment compared to fibronectin for HFF-1 cells to proliferate. The first possible reason for this could be (α1β1, α2β1) type of integrin that was present on the surface of an activated fibroblast cell which interacts with GFOGER sequence in collagen and this causes direct binding of collagen to the integrin of cell surface and helps to proliferate fibroblast cells on a collagen matrix.34 Fibronectin binding is important for tissue regeneration35 and hence collagen was consistently used to coat plates throughout this study for cell proliferation assays of both muscle and non-muscle cells. Cell proliferation assays were performed at varying concentrations of creatine and turmeric. Creatine as well as turmeric have limited solubility in water. Therefore, they were both initially tested at lower concentration ranges on muscle and non-muscle cell lines. In this study, creatine only treatment on muscle cells showed a higher rate of proliferation than non-muscle cells and in contrast turmeric only treatment displayed a higher rate of proliferation on non-muscle cells than a muscle cell. This differential cell behavior between the creatine treatment and turmeric treatment for muscle and non-muscle cells could be due to their anti-inflammatory and antioxidant properties.3,8,36
Creatine is known for its property of increasing ATP synthesis and may cause an increase in muscle cell growth.2,5 Creatine’s effect of increasing ATP synthesis was reinforced by observing the increased proliferation rates seen in L6 muscle cells. This increase in ATP synthesis may aid non-muscle cells in reaching confluency before day 7, resulting in contact inhibition and decrease the cell growth for non-muscle cells. It also suggest that muscle cells needed more energy compared to non-muscle cells. The decrease in HFF-1 proliferation also might be due to the antioxidant property of creatine.3 The tested concentrations of creatine may act as an antioxidant on non-muscle cells by blocking oxidative pathways of cells and resulted in cell inhibition. Our results suggest that creatine has multiple roles, on muscle cells causing energy generation and on non-muscle cells it may act as an antioxidant. Non-muscle cells (HFF-1) showed a better rate of cell proliferation with turmeric when compared to muscle cells. This increase in proliferation could be attributed to the anti-inflammatory property of turmeric. The concentration ranges for the combined study were selected based on the individual impact of creatine and turmeric on fibroblast cells (non-muscle). DMSO was used as a solvent to dissolve turmeric while checking the effect of turmeric. Therefore, for testing the combined effect of creatine and turmeric DMSO was used as a vehicle for all experimental conditions. DMSO is cytotoxic in nature and the presence of DMSO may decrease survival and viability of cells. Therefore, creatine and turmeric concentrations were increased (650µg/mL and 92.5µg/mL) for testing their combined effect on both the cell lines. For the combined treatment, a difference in treatment response was observed for both muscle and non-muscle cell line. Non-muscle cells showed a significant increase in proliferation rate compared to the muscle cell. The combined treatment on non-muscle cells showed an increase in the proliferation rate of non-muscle cells after 7 days of treatment with creatine or turmeric alone. Creatine alone caused an increase in proliferation than turmeric alone for a 7 days period. The combination treatment had a lower proliferation rate than creatine and turmeric alone. The combined treatment for muscle cells had a higher proliferation rate than creatine or turmeric alone. Turmeric alone showed better proliferation than creatine alone for a 7 days period although results were not statistically significant. The energy generation or antioxidant property of creatine and anti-inflammatory or antioxidant property of turmeric may be involved in the varying effect of creatine and turmeric on the proliferation of muscle and non-muscle cell line.2,3,9,37 However, other factors such as the nature of cell line may also be responsible for this behavior. This data suggested that the effect of creatine and turmeric are vastly different on muscle and non-muscle cell lines and an alternate approach may be needed for studying them. Although the results of this experiment at a cellular level are not promising, increased use of creatine and turmeric as a supplement lead us to think whether they should be used separately or in a combined manner for their potential health benefit. There was no significant effect observed for the combined treatment on muscle cell which suggested that a combination of turmeric and creatine may not be effective in post-workout recovery although there was a significant effect observed for non-muscle cell proliferation (fibroblast) for combined treatment. This may suggest that creatine and turmeric together may be beneficial for use in skin cosmetics formulations such as anti-aging cream. The combined effect of creatine and turmeric can also be checked on normal, wounded and diseased skin cells. Creatine has multiple roles, antioxidant property of creatine can also be tested in presence of potential oxidising agent such as hydrogen peroxide on muscle and non-muscle cells. Creatine effects can also be checked on neuronal cell lines in order to understand the role of creatine in the central nervous system.
None.
The author declares there are no conflicts of interest.

©2019 Calixto, et al. This is an open access article distributed under the terms of the, which permits unrestricted use, distribution, and build upon your work non-commercially.