Journal of
eISSN: 2572-8466


Research Article Volume 6 Issue 4
National University of Science and Technology, Zimbabwe
Correspondence: Clifford Tafangenyasha, National University of Science and Technology, Environtek, P O Box CY 161, Causeway, Harare, Zimbabwe
Received: June 12, 2019 | Published: August 19, 2019
Citation: Tafangenyasha C. Can biosensors and sensors operating in a complex matrix of local and international standards solve environmental quality problems of catchments? J Appl Biotechnol Bioeng. 2019;6(4):199-208. DOI: 10.15406/jabb.2019.06.00193
This research aims at throwing light on applications of biological rapid assessment tools in the monitoring of environmental quality in Runde River catchment with intensive commercial sugarcane production. Burdened with drudgery in wet laboratory techniques, biological sensors (biosensors) and sensors can integrate catchment data from rapid assessment techniques to networks or Internet of Things (IoT). This research examines the techniques presented by biosensors and sensors and provides the checkboxes for sustained catchment monitoring. With available recent evidence from surveys it turns out the Runde River may not be polluted but this may reflect the time the survey was undertaken and suggestions made for routine checks.
Keywords: biosensors, sensors, catchment water quality data, benthic macro organisms, monitoring, network
The prospects of global warming and climate change now termed global climate crisis or global climate emergency require re-tooling of ideas to protect human health and ecosystem processes to escape the dilemma.1 Biomarkers (biological markers) employed in biotechnology may include both biosensors and sensors but this distinction may not be readily obvious and the need to elucidate the term with practical application of areas. Biosensors (Biological sensors) and sensors are devices produced to measure change in living organisms or media and have a commonality of detecting the pulse of the environment and improve on it. Biosensors may be molecular solutions or reagent markers, sometimes devices whereas sensors may be physical devices designed to measure a physical phenomenon. They transform bio-geo-chemical responses into electrical signals. Wet laboratory mistakes can undo irreparable harm to human health, ecosystem processes and biodiversity conservation. The degree of intrusion by a foreign body to a human being can cause change in the harmonious function of the circadian rhythm or biological clock and can be measured by an established procedure or an instrument such as physician’s stethoscope, laser coupled thermometer, ion concentration laser to give a positive/negative feedback. Types of wearable and non-wearable biosensors available in the market are glucometers, optrodes, immunosensors, chemical canaries, resonant mirrors, biochips, and biocomputers.
Over hundreds of years, the search for easing the drudgery in laboratory methods has been ongoing, gaining in momentum the issue of improving environmental quality. There is an increased interest in shortening time spent doing laboratory assays particularly in hot spots of environmental pollution and epidemic eruptions. Biosensors have been applied in many fields such as water quality monitoring particularly in most large bodies of water (Oceans, Seas, Lakes and Rivers). Biosensors are ubiquitous in the environment in sediments, water columns, and plants, and atmosphere and more closely in agricultural ecosystems. Living aquatic organisms, fossilised plants and their pollen are important biosensors useful in conservation plans. Biosensors may breakdown during episodic phases such as wildfires, extreme precipitation events and drought, floods, extreme temperature, landslides, dry mass movements, extra-terrestrial impacts, volcanic activity and earthquakes. As enzymes denature due to extreme temperature organisms weaken and gradually perish due to exceedances in tolerance levels.
Invertebrates are a critical component of the aquatic food web of any waterbody.2 The insects and crustaceans that live in streams are indicators of water quality, because all organisms require specific conditions to live. If the water quality is poor, or if a polluting event occurred within the past few months, it will be reflected in the benthic macroinvertebrate (hereafter BM) population.2 Invertebrates provide valuable food resources for other invertebrates, fish and waterbirds.2 A change in invertebrate assemblages can directly and indirectly affect the rest of the food web, causing ecological and economic change.3
Aquatic invertebrates are primarily affected by turbulence, light intensity, temperature, food availability and dissolved oxygen.3 Benthic fauna are characterized by high taxonomic diversity, and rapid response of most of its constituent members to environmental cues such as dissolved oxygen, quantity and quality of food, current, light, substrate quality and predation. Samples of benthic macroinvertebrates are often collected from a stream, identified and a water quality rating of stream established. Water quality ratings of excellent, good fair and poor are based on the tolerance levels of the organisms found and the diversity of organisms in the sample.4 A stream with excellent water quality should support organisms from all three pollution tolerance groups.4
Waters enriched with organic matter, sewage have highly restricted fauna.5 Some of the BM are of human health importance. Out of 13,789 snails collected 916 (6.6%) harbored potent trematode infections by Chimbari and Ndlela. It is important to curtail water borne diseases by directing eradication efforts at relevant sites and vectors. Moyo & Phiri7 noted a decrease in the occurrence of molluscs along the Mukuvisi River, at a site with heavy metals associated with industrial pollution. Mathuthu et al.,6 observed a decrease in parasitic diversity of African catfish Clarias gariepinus that was related to increased organic pollution in the upper Mukuvisi River.
A sharp decrease in the number of taxa along the Mukuvisi River was explained by a decline in water quality.7 Mathuthu et al.,6 found that BM communities at sites with a burden of heavy metals are dominated by midge (Chironomidae) larvae. Moyo & Phiri7 found a high number of oligochaetes among the BM community collected from Mukuvisi River and associated this with evidence of organic pollution. The decline in BM diversity on the Mukuvisi River may be largely a result of the decline in water quality along the course of the river.7 This paper looks at environmental monitoring using biosensors and sensors in order to ease the drudgery in tenuous and lengthy wet laboratory procedures to protect human health, ecosystem processes and biodiversity conservation.
The main objectives in the study were modelled around the need to secure human health, ecosystem processes and biodiversity conservation from the conceived development projects in the southeast lowlands. Other subsidiary objectives include:
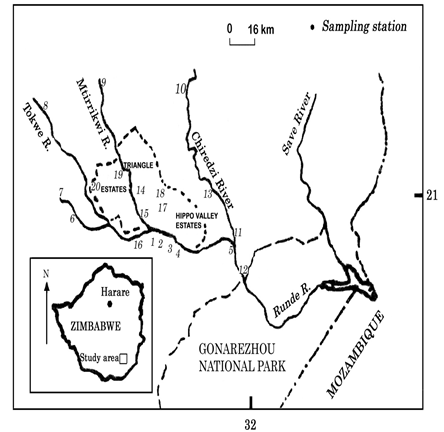
Figure 2 Simplified map of the southeast lowveld river system showing location of the different sampling stations along the studied watercourses.
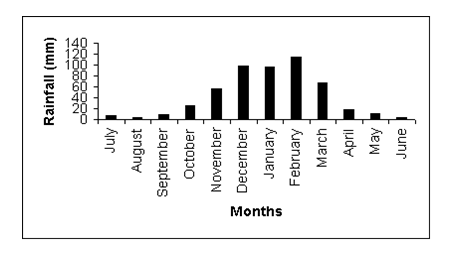
Figure 4 Mean monthly rainfall at Gonarezhou National Park based on data collected over 31 years (Source: Department of Meteorological Services, Harare).
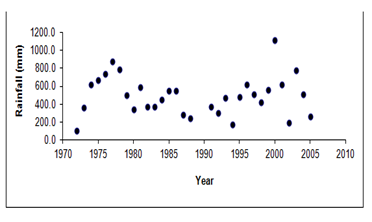
Figure 5 Long-term annual rainfall record for the Gonarezhou National Park (n=31, CV=50 %) (Source: Department of Meteorological Services, Harare).
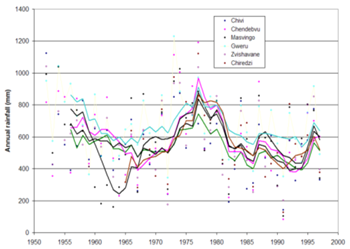
Figure 6 5-year running averages of annual rainfall totals in the Runde catchment at Chendebvu, Chiredzi, Chivi, Gweru, Masvingo and Zvishavane.
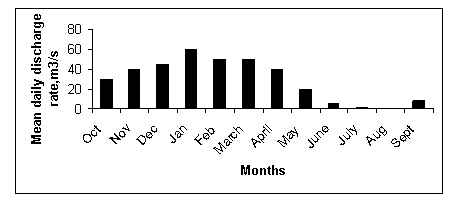
Figure 7 Annual discharge at the Runde discharge gauge station, Masvingo. The change in mean daily discharge rate, m3/s in the Runde River (Source: Department of Water and hydrology, 2010).
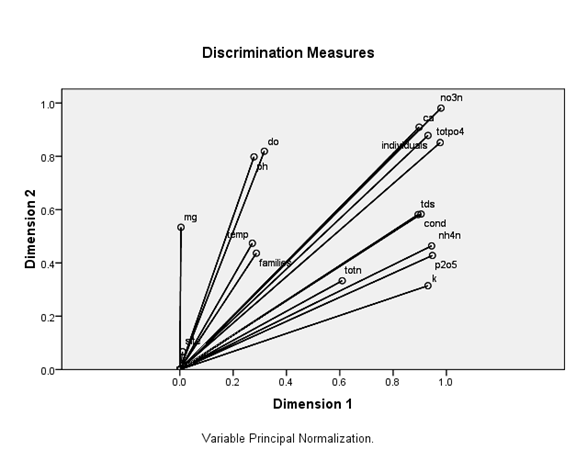
Figure 12 Redundancy Analysis biplot (D1x D2) of macroinvertebrates and environmental variables (arrows). Arrows refer to the direction and relative importance of environmental variables in the ordination.
Biosensors establish preferred calibration level in environmental variable measurement for purposes of improvement. A departure from a standard implies degradation or deterioration in quality of matter. Examples of biosensors include coral organisms which bleach if unacceptable water quality is prevailing. Other incidences of water pollution include eruptions of cholera, typhoid, bilharzia and acid rain. Bio prospecting of biosensors is ongoing and an essential exercise today given the current wave of development in catchments. Biosensors guide precision measuring interventions in water, air and living organisms (plants, animals, media). Biosensors offer advantages over many conventional environmental tools such as rapid results for decision making. Biosensors and sensors measure variation, list presence/absence of organisms in the media (freshwater, marine, brackish water, grey water) organs, cells, and tissues. Biosensors data are transacted for interventions. By siting sensors at key outfall discharge point’s sustained evaluation of key sites enable determination of direction, magnitude and frequency of pollution events important for regulation.
Concentrations of ammonia nitrogen, total nitrogen TN and total phosphates TP, nitrates, nitrites, phosphates in mg/l are the classification criteria into eutrophic and oligotrophic substrates.8 But biosensors conjectures may not be the end in themselves as data must be verified by chemical assays. Local and International Standards check the acceptability of the water quality data. A variety of bio prospecting exercise require guide books/manuals and tailored expertise in value chain monitoring. Efficient biosensors replace inefficient biosensors in Io T. In media radio isotopes may be used in radio carbon dating. Biosensors classify environments, animals, and plants into different categories for remediation.
Environmental biosensors
Catchment integrity monitoring may be pursued by establishing checkboxes and a number of sampling points along watercourses in disturbed and undisturbed zones. Checkboxes may be derived conjectures to simplify catchment analysis. A total of 10 sampling stations were located at accessible sites in the Control zone and 10 in the Test zone of the study area in south east Zimbabwe. Control zone was characterised by low input peasant agriculture and the Test zone comprised intensive commercial agriculture with emphasis on green sugarcane production. Wet laboratory samples were collected for determination of water quality variables. Biosensors determined water quality in areas provided by checkboxes using key guides of BM. Sensors comprised water quality test meters for electrical conductivity, turbidity and Ph. No single test is perfect.9 Biosensors’ capability include real-time measurements in checkboxes of important catchment media (CHBM).
CHBM1: Contamination by air
Water quality in waterbodies may be influenced by contaminated air such as acid rain. Air quality maintenance is a prerequisite for proper functioning of living organisms. Air quality must comply with local SAZ and WHO Standards. Sensors such as installed in balloons, mobile air quality monitors and static real time mappers of concentrations of gases record composition, changes in concentrations, aerosols, Acids, Alkalis, particulate matter (dust), pollen, wind direction and speed, presence/absence of inversions, altitude, water vapour, smog and visibility. Hydrogen, carbon, oxygen, nitrogen, phosphorous, potassium, sulphur, chlorine, sodium, boron, CO2, CO, NO, NO2, NH3, SO2, H2S, SO4, methane, boron, fluorine may be determined using gas analyzers. Bacteria are determined using incubation protocols. Radiation (Alpha, Beta, Gamma particles) may be determined using Geiger counters. IPCC attribute climate condition to factors such as biotic processes, variations in solar radiation received by Earth, plate tectonics, and volcanic eruptions. Certain human activities have been identified as primary causes of ongoing climate change, often referred to as global warming. Besides CO2, methane (CH4), nitrous oxide (N2O), fluorinated gases, ozone (O3) and water vapour are important greenhouse gases. Air quality data are checked for compliance against Local and International Standards and rose charts are plotted in pollution pattern analysis.
CHBM2: Catchment soil quality
Catchment soil quality is characterised by determining porosity, aeration, microorganisms, OM, soil water, density, structure, soil texture, toxic heavy metals, acidity and alkalinity and soil micro and macro nutrient deficiencies. Microorganisms’ abundance, variety or diversity and type, organic matter have immense importance in soil quality. Knowledge of the hydrological pathways by which water moves from the catchment into the river channel is essential for understanding the controls on water quality in streams.10 Catchment leaching and subsurface flow is of concern since it alters water quality in waterbodies. The monitoring of catchment outflow is often targeted at sites along disturbed river fronts and up streams.
CHBM3: Catchment river sediment quality
Sediments in water bodies are sinks of adsorbed nutrients including phosphates and nitrates accumulated in runoff in catchment and human activities. Nitrates in tropical and subtropical freshwaters and marine ecosystems originate largely from point sources such as mineral fertilizers and sewage. Nitrates above 300 mg/l indicate eutrophic conditions and risk methaemoglobinemia poisoning in infants. Adsorbed to sediments nitrates are released slowly to the water column. Nitrate monitoring is an important task. Mercury poisoning from activities of gold panning is another aspect of monitoring. Detection of life forms along drainage channels, streams, rivers and static waterbodies should be an ongoing integrated activity in water quality monitoring to protect trophic cascades.
The relationships among the plots are visualized in a biplot (Figure 13). The plots have been grouped according to the relative influence of environmental variables. The pattern of the plots shows the failure of the environmental factors to discriminate the plots into degraded and undegraded water quality suggesting that the salient features of degradation of water quality play a minor role in determining the condition of the river water. Plot 4 denotes a point source discharge channel, the only exception to have separated from the group of plots. The position of 4 as distinct from the rest of the plots shows the importance of point source regulation in environmental protection.
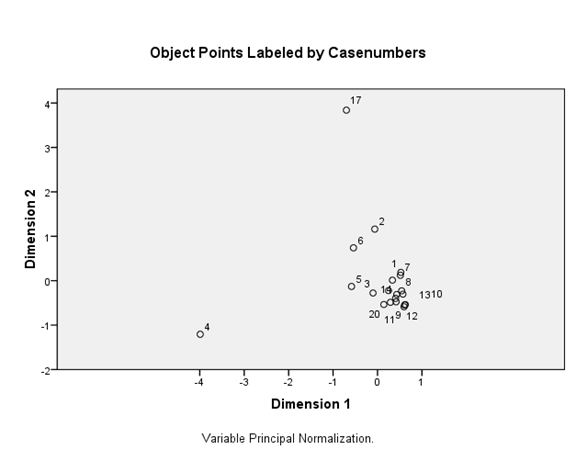
Figure 13 PCA output of investigated sample plots in water quality and BM families and individuals. Notes: PC1 explained 85.9%, PC2 explained 48.8%.
CHBM4: Catchment grey water quality
Catchment domestic wastewater is most often laden with nutrients, faecal coliforms, salmonella bacteria and detergents. Industrial wastewater and mineral processing and power plants wastewater is most likely to be laden with heavy metals, alkalis and acids, hot water, acid mine drainage and radiation. At the outfall discharge points eutrophic, heat islands and sterile ecosystems can manifest. Physa acuta nicknamed sewage snail is frequently found in organically polluted water and oxygen poor water.11 Grey water discharge points are often flagged and colour coded during monitoring for environmental compliance. Environmental biosensors often indicate effluent quality in post treatment phases before discharge to the environment.12 Temperature, DO, light penetration, SS, TDS, chlorine, electrical conductivity. Nitrates, sulphates and chlorides levels are routinely monitored by sensors.
CHBM5: Catchment brackish water
Backwaters of the Runde River channel flow constitute brackish water. Brackish water life forms are limited by pollution and low DO, ph and high temperature.3 Catchment brackish water biosensors include temperature, ph, TDS, SS, chlorine, salinity, electrical conductivity, OM, turbidity, light penetration and bacteriological contamination all of which is monitored by sensors. Escherchia coli is of concern but should be zero in potable and other domestic water uses.
CHBM6: Catchment freshwater quality
Water quality in rivers is a function of climate, soils, geology, land use and hydrology.10 A knowledge of the hydrological pathways by which water moves from the catchment into the river channel is essential for understanding the controls on water quality.
The integrity of benthic invertebrates is usually the first in the line of procedures in water quality monitoring. These examples represent numerous organisms with differing feeding mechanisms, including detritivores, deposit feeders, and filter feeders. A variety of molluscs such as clamshells and bivalves indicate tolerance to lime/gypsy rich effluent vital in the construction of protective shells. Keys to orders, genera and species are made reference to. There are many variables of water quality at monitoring points, including pellucidity, calcium, magnesium, potassium, sodium, orthophosphates, TP, TN, DO, NH3-N, and CODmn, BOD5, and CODcr all of which is monitored by sensors.
CHBM7: Estuary water quality
The Runde River probably changes its chemistry, physical characteristics and organic load from its source on the Zimbabwe watershed to its terminal point in the estuary of the Mozambique coast in the Indian Ocean. Pollution rips integrity of freshwater and marine water important for spawning of fishes and breeding of aquatic and marine animals. Integrity of coral reefs is at risk from global warming and transport spillages and leaks. Sensors measure temperature, ph, DO, OM, SS, TDS, electrical conductivity, light penetration, carbonates, chlorides, sulphates and cations of the Runde River water. Sensors measure ionic composition of water quality that is critically important for feeding, breeding, detection of predators and escape routes and resting of freshwater and marine life forms.
CHBM8: Catchment land uses
Biosensors of acid mine drainage, toxic mercury effluent, organic load and mineral fertilisers’ applications and runoff and leaching. Biosensors and sensors at key nodes of outfalls signal exceedances in environmental limits. Tafangenyasha & Ngorima1 noted that Tropical Circulation activity and Cyclonic precipitation especially hurricanes induce severe storms which may disrupt infrastructure, dilute river water and diffuse runoff, and throw into disarray biosensors and sensors. Biosensors and sensors may breakdown during Tropical Cyclone activity.
Biosensors of biological functions and processes
Animals
Dairy industries, feed companies and beverage industries and various food manufacturing companies (animal feed companies) employ biosensors to comply with food quality standards such as electrical conductivity, pH indicator alzarine test on milk and E. coli in milk.9
Plants
Environmental impacts of growth and reproduction enhancements are of growing concern due to the ever increasing need to increase yield and performance in varieties employing genetically modifying objects (GMO). Pollination vectors, sterile fallouts and disease compromises are of global concern to quarantine potential epidemics. Presence/absence of insect species and density of species of insects visiting flowering sites may be of special interest in capture mark release nets.
Biochemical processes
Fermentation, distillation and equipment rinsing use biomarkers to facilitate process control at various key points in industry. Emissions of a variety of gases such as methane, carbon dioxide, sulphur oxides, nitrous oxides, and vapours should always be within acceptable regulation colour codes. Effluent always finds its way to pre-treated and recirculation treatment tanks if ph. and SS exceeds limits and is re-tested before discharge to the environment.
Rangeland quality
Biosensors enhance management of environmental quality by highlighting ecosystem changes and their resultant cause effect solutions. Dominance/rarity scores of desirable species provide for improvements in human wellness and safety. Management of stocking densities may manipulate increaser species towards a desirable direction. Annual rings indicate tree age that is critical to harvesting of species and conservation of flagship species such as Baobab.
Time
Biosensors also occur naturally as annual rings on polished cross sections of tree species, annual rings on shells of Mollusc, pollen and ash midden. Pollen and ash midden act as reservoirs of time which may be radiocarbon dated. Biosensors, embedded in a format of time; act as storehouses of epochs of earth’s geological history, adaptation and evolution, and a telling story of global climate change, erosion cycles, lotic and lentic fluctuations affecting freshwater, marine life and fisheries. As rivers changed their courses, base levels, competence, velocities through time and stratigraphy so did load, concentrations, dilutions, capacity and interactions with Oceans, Lakes, Seas, bays and estuaries. Ideally, river water monitoring from source to mouth through time result in actionable visual perceptual maps/charts of ecosystem processes and water quality.
Environmental Sensors
A variety of sensors are already in use. Most sensors use pressure, position, temperature, or acceleration, and respond with feedback in devices frequently used to detect and respond to electrical or optical signals. The specific input in sensor devices could be light, heat, motion, moisture among others. Sensors for Temperature, ph, DO, OM, SS, TDS, TP, TN, NH3-N, and CODmn, BOD5, and CODcr electrical conductivity, salinity, light penetration, carbonates, chlorides, chlorine, nitrates, sulphates, provide for routine assessment the Runde River water quality. The seamless connectedness of data to network or IoT is by no means complete but serves as checkboxes to be filled once the platform is ready for launching.
Checkboxes of environmental compartments address minimal criteria of coverage of impact areas important for directing biosensors and sensors in sampling. Additive sampling follow remaining areas in the checkboxes that provide data for other solutions to impacts. In time comprehensive measurements complete knowledge for containing impacts. To make networking possible in catchment monitoring, it may be obligatory to have networking hardware, servers, routers and switches, interface development, software modelling and embedded software.
Hypotheses
Ambient Air quality may be measured free from obstacles of tree lines and buildings in erected instrument boxes with large louvers’ on the four edges of arable land and or built up areas using combination of sensors designed to record gases in wet air deposition and dry air flow:
Ambient Air Quality monitoring sensors are devices used for continuous ambient monitoring, passive sampling and pen plotting over 24 hour day and night, every week, every month and every year at suspected sites of waste generation and disposal, sewage ponds, material storage facilities and livestock pens. Filters: Ambient (AT-3000) model series gas analyzers measure fluorinated gases, water vapour and ozone that are important greenhouse gases. Geiger counters record radiation including radon, alpha, beta and gamma particles that are airborne and soil substrate emitted.
Baghouse filters sample particulate matter using a variety of air quality filter models equipped with sensors.
Air filters and wet scrubbers’ measure intensity of light pollution (smog) and intensity of visibility and amount of particulate matter (dust) suspended in air. Ambient air optical sensors may be linked to transducers that relay data to software and continuous trend line series graph and rose chart plotters. Ambient air quality samplers and recorders must be installed at liquid and solid wastes generation sites such as sewage tanks and ponds, molasses stockpiles and at agricultural processing sites.
Water samples were collected using protocols described by Mackereth,13 Marshall,14 Wetzel.3 The water samples were analyzed using protocols described by Golterman et al.15
Benthic samples were taken in the dry season August 2003 and wet season of April 2004 in the upstream of Chiredzi, Mtirikwi and Tokwe Rivers at Hippo Valley and Triangle Sugar Estates (Figure 2), using a SASS4 protocol for water quality described by Gratwicke,16 Dallls17 and Vos et al.4 Collections of the invertebrates were made using a standardized net. The collector moves upstream pushing and rubbing stones with his feet, attempting to disturb the substrate to a depth of about 10 cm, the net being held just downstream, to catch animals carried away by the current.16 Sampling usually took about three minutes, and this is in a series of short, thirty second bursts. The invertebrates were then tipped into a shallow tray where they are separated from debris and identified down to family level. The presence or absence of a family is noted on the SASS sheet which has sensitivity ratings on it.17 When the score of each family present is added up, it gives a total which is called the sample score.17 When this is divided by the number of families present, an average score per taxon (ASPT) is given.17 The ASPT is, therefore, a measure of the average sensitivity of all the organisms present to organic pollution.16,17 The limitations and the problems involved in using a grab of this type have been noted by and Karr.19 Upon retrieval all accumulated material from the samplers were collected and preserved. The collected organisms were identified at the family level and genus. List of families collected from the rivers was compiled. Live sorting and preliminary counting of readily identified taxa were carried out in the field, before preserving the sorted invertebrates in 70 % isopropryl alcohol for laboratory identifications and checks using keys of Thirion, Appleton,11 Braack21and Picker et al.20
All benthic specimens were examined with an Olympus binocular microscope, using an objective lens with a zoom magnification from 0.7 to 4.0 and eye-pieces of 15x magnification. When necessary an adapter lens fitted to the objective doubled the magnification. All measurements were done using a calibrated 1 mm eye-piece scale.
Illustrations or sketches in guide books21,22 were used as a guide to nomenclature of specimens. Illustrations were schematic and were intended to show pattern characteristics rather than precise anatomical detail. In those groups where mesonotal and abdominal markings, as well as wing patterns, provide taxonomic characters, dorsal views of the whole insect was also used. In other groups, where body markings provide few or no usable taxonomic characters, wings were also considered. Identification of the insect specimen was done at the family and genus level. Data analyses were also done using Excel. Inter-site differences in concentrations of nutrients were analysed using ANOVA.
The following references were used for the taxonomical determination of species: Parish,21 Braack,22 Thirion, Picker et al.,20 and Appleton.11 In order to determine the changes in species composition in relation to different treatments in relation to water quality, the Shannon Index (H¢) was calculated. The Shannon Index for each treatment was calculated using the formula.23
where pi is the fraction of the entire population made up of species i, and ln is the natural logarithm.
The value of the Shannon-Wiener Index usually lies between 1.5 and 3.5 for ecological data and rarely exceeds 4.0. The Margalef diversity index is calculated as the species number (S) minus 1 divided by the logarithm of the total number of individuals (N). The calculation uses the natural logarithm:
Multiple Correspondence Analysis (MCA),24 examined the direct and indirect effects of a gradient in nutrient concentration and hydrologic disturbance on benthic community structure in the study area. Model results should indicate the relationship between nutrient concentration, physico-chemical characteristics, and benthic fauna. The results should imply the direction of the response of stream benthic communities to nutrient stimulation. The Correspondence procedure was used in SPSS25 to identify the two strongest underlying factors in the relationships between the water quality variables. By assigning each variable a specific number within each dimension, the information was displayed in an easily understood chart, commonly called a perceptual map.
Physical and chemical properties
The river water quality in the study area fluctuates with time and depends much on effluent discharged at point source and non-point source discharge outfalls. Surface water temperature was narrow (21.8-26.5°C) with a mean of 24.3°C, conductivity values were between 170.2 mScm-1 and 567.4 mScm-1 (April and May) with a mean of 305.5mScm-1.
Major animal taxa
No BM were found in April when the rivers were in flood. The animal taxa encountered in the sampling sites are shown in Table 1. In August site 13 recorded the highest percentage (33.1%) of different BM and this was followed by site 4 (13.8%) a discharge point (Figure 11). The seasonal distribution of phyla (Figures 8,9) shows a community dominated by mollusks (gastropods and bivalves), which contributed between 50.7% (August) and 52.8% (May) of total fauna collected. Table 1 summarizes the composition of the taxa caught into orders. Figure 9 shows a strong relationship (r2=0.62) between BM and dissolved oxygen.
Order |
Family |
Genera |
Acari |
Hydrachnidae |
Hydrachnah |
Anisoptera |
Gomphidae |
Ictinogomphus |
Coleoptera |
Dysticidae |
Cybister |
Gyrinidae |
Aulogyrus |
|
Hydrophilidae |
Hydrophillus |
|
Psephenidae |
Cybister |
|
Collembola |
Sminthuridae |
Sminthurus |
Crustacea |
Arrenuridae |
Arrenura |
Diptera |
Chironomidae |
Chironomus |
Ephemeroptera |
Heptageniidae |
Afronurus |
Baetidae |
Baetis |
|
Hemiptera |
Belostamitadae |
Belostoma |
Gerridae |
Gerris |
|
Vellidae |
Velia |
|
Megaloptera |
Corydalidae |
Taeniochauloides |
Mollusca |
Corbiculidae |
Corbicula |
Limnaediae |
Limnaea |
|
Planorbidae |
Planorbis |
|
Helisoma |
||
Gyraulus |
||
Promenetus |
||
Physidae |
Physa |
|
Sphaeriidae |
Sphaerium |
|
Pisidium |
||
Eupera |
||
Quadrula |
||
Unionidae |
Coelatura |
|
Odonata |
Aeshnidae |
Aeshna |
Anax |
||
Chlorocyphidae |
Platycypha |
|
Libellulidae |
Libellula |
|
Coengriidae |
Agrion |
|
Trichoptera |
Hydropsychidae |
Hydropsyche |
Table 1 Summary of benthic macroinvertebrates identified in all sample stations
Species richness and abundance
The benthic population (no.net-1) caught in May show that site 4 had the highest numbers (25.2 animals/net-1) and sites 5 and 9 also recorded very high densities (Figure 8) (Table 2). Figure 9 shows that sites 3, 4, 14 and 17 had very high populations with the highest being recorded at site 14. In May very high relative abundances were recorded at site 4 (26%), site 4 (19.1%), site 8 (18.2%) and site 3 (11.8% (Table 3)). No BM were collected in lined water supply canals (sites 15 and 18). The gastropod mollusk was the most abundant, Limnaedae and Planorbidae, were the most abundant genera present throughout the sampling period (Table 3). Densities ranged between 50/m2 in May and 48/m2 in August.
Limnaedae ranked first in density among all species collected on all sampling dates. Belostamitadae ranked second to Limnaedae (Table 2). Other high ranking fauna were Planorbidae, Unionidae, Hydrachnidae, Sphaeriidae and Gyrinidae (Table 2). But there is no evidence that dominance change with time. The benthic dominance ranks shifted with changes in month (Table 2).
|
May-05 |
Aug-04 |
Aeshnidae |
8 |
2 |
Baetidae |
6 |
10 |
*Belostamitadae |
2 |
|
Chironomidae |
6 |
|
Chlorocyphidae |
9 |
|
Coengriidae |
5 |
10 |
Corbiculidae |
6 |
2 |
Corydalidae |
7 |
|
Dysticidae |
10 |
|
Gerridae |
6 |
6* |
Gomphidae |
7 |
|
Gyrinidae |
5 |
|
Heptagenidae |
6* |
|
Hydrachnidae |
5 |
4 |
Hydrophilidae |
6 |
|
Libellulidae |
8 |
|
Limnaedae |
1 |
10 |
Physidae |
6 |
8 |
Planorbidae |
3 |
1 |
Psephenidae |
6* |
|
Sminthuridae |
3 |
|
Sphaeriidae |
5 |
6* |
Unionidae |
4 |
|
Vellidae |
7 |
7 |
Table 2 Ranking of benthic macroinvertebrates at sample sites between May and August
*same ranking
Figures 10,11 shows that the BM Margalef index for the control sites was lower than that of the test sites suggesting differences in nutrient levels and sources. The Margalef index measures species richness and it tries to compensate for sampling effects.25 For other commonly used diversity indices such as Shannon index24 the proportions and not absolute numbers are considered. No significant differences were found in the Shannon index for BM between the control and test sites in all the study periods (Table 3).
Method |
Control site |
May Test site |
Sig. |
Control site |
August Test site |
Sig. |
|
Shannon index |
-0.996 |
|
-0.4117 |
NS |
-0.885 |
-0.4746 |
NS |
Table 3 Average BM indices and diversity indices and t test results
Figures 12,13 show ordination diagrams which are based on Factor Analysis and Canonical Correspondence Analysis (CCA) of the associated water quality with BM organisms. The diagram of ordination displays the basic clusters (Figure 13) obtained by the classification technique. The BM families and individuals are located in the top plane of the right side between axis I and II. These organisms are followed by the cations Calcium, Magnesium and DO. TotN, NO3N, NH4N and TotPO4 show a special pattern and are separated in one group in negative side between axis I and II. Figure 14 shows dissolved oxygen concentration in the water column test and control stations.
A t test of the mean density (no.m2), however, did not show significant differences (p>0.05) above and below effluent outfall suggesting that BM settlement areas may not be explained in terms of nutrient concentrations. Attempts to explain distribution of species in terms of chemical differences may not always have much success except where conditions are extreme. BM density (no.m-2) response to perturbation certainly does not support the notion that the Runde River is severely polluted by the upstream agricultural activities. Vesilind and Weiner suggests that benthic community responses to environmental perturbation are useful in assessing the impact of agricultural wastes. BM were abundant in all streams, but communities did not reflect degraded conditions; noninsect groups, mostly Mollusca, Hemiptera and Odonata dominated density and mollusks, mostly Planorbidae and Corcubilidae, dominated biomass. Of insects, mostly Odonata, dominated density and Hemipterans were important contributors to biomass.
The presence of dissolved oxygen in river water is a factor important for maintenance of life of many aquatic organisms.27 In times of excessive organic matter inflows, much decomposition may arise, in deeper pools a condition of complete oxygen deficiency may arise but this is unlikely since most pools are shallow. The waste products of metabolism, dead animals, plants and detritus all fall to the bottom of the substrate (2009). Here oxygen is used up in the decomposition process, which occurs in and on the bottom of the sediments. It is likely that agricultural development in the vicinity of the Runde River has preserved the integrity of BM in the Runde River, and its ecological impacts were relatively small. As this study has illustrated, there has been no impact on the taxa and abundance of most BM. Seemingly, biosensors and sensors play out complimentary roles in catchment monitoring and management.
Biosensors and sensors have given researchers powerful inspiration for new exploration of ideas in the interrogation of environmental quality over time. BM may be signatures of environmental quality due to continuous pollution bombardment, bio concentration of organic pollutants and presence of chemical pollutants in the water column, and bioaccumulation in sediment. Presence/absence of BM do show impaired water quality but do not show type of chemical pollutant, chemical assays do show the identity of a pollutant. Standards serve as criterion decision quality yardsticks. Water quality maintenance requires cooperation among local and international stakeholders in areas such as food supply and the environment and human health. Judgement on degree of affected environmental quality may be inferred from statistical tests and visual perceptual maps. Biosensors and sensors and standards facilitate evidence in water management and dialogue. The goal is application of standards at outfalls, water bodies and trophic cascades. In the foregoing, the hypothesis that human interference in lowland ecology through development has an adverse impact on the water quality and aquatic ecosystems is rejected, as this study has shown, integrated catchment management may benefit BM important in trophic cascades and fisheries.
Authors need to thank Dr. Anura Kandasamy for the support in organizing this research.
The author declares there are no conflicts of interest.
None.

©2019 Tafangenyasha. This is an open access article distributed under the terms of the, which permits unrestricted use, distribution, and build upon your work non-commercially.