International Journal of
eISSN: 2576-4454


Research Article Volume 9 Issue 2
Department of Urban and Regional Planning, Rivers State University, Nkpolu-Oroworukwo, Port Harcourt, Rivers State, Nigeria
Correspondence: Brown Ibama, Department of Urban and Regional Planning, Rivers State University, Nkpolu-Oroworukwo, Port Harcourt, Rivers State, Nigeria
Received: May 05, 2025 | Published: May 19, 2025
Citation: Ibama B, Omolola O, Oscar AL. Spatiotemporal dynamics of Anthropogenic Triggers of Wetland Loss and Degradation in the Obio/Akpor Region between 1990 to 2020. Int J Hydro. 2025;9(2):46-51. DOI: 10.15406/ijh.2025.09.00402
Wetlands are one of the world's most productive ecosystems, benefiting humans and the environment. Wetlands are natural assets that can deliver ecosystem services from local to regional scales; despite their value, wetlands are being degraded at an unprecedented rate. The study assessed the extent of wetland loss and degradation due to human activities between 1990-2020 in Obio/Akpor LGA, Rivers State, Nigeria. The study adopted a mixed-method research approach with a cross-sectional research design. The study employed purposive sampling techniques to select the sampled community and respondents. A total of 5 communities were selected for the study, and a 399 sample size was determined using the Taro Yamane formula. The study found that between 1990-2000 and 2010-2020, wetlands had a percentage loss of -10.2% and -5.33%, respectively, indicating an immense loss in wetland ecosystems in the study area. Based on the findings in the research, the following recommendations must be considered which include Government at all levels should encourage the use of green infrastructure, low-impact development techniques, and innovative growth principles to protect wetland ecosystems, Government with the aid of environmental agencies should enhance existing regulations and enforce stricter policies to control human activities and these regulations should prioritise wetland protection and restoration while promoting sustainable land use practices, planning body should strictly enforce the land use control measures utilising sub-division regulation, zoning ordinance, building and housing codes including site and service approach and Government should engage local communities, stakeholders, and decision-makers through outreach programmes, workshops, and educational campaigns.
Keywords: Anthropogenic, Degradation, Obio/Akpor, Triggers, wetlands, wetland loss
Wetlands are significant features in the ecological cycle. They serve as a refuge for wildlife, as nutrient and pollution filters for water quality improvement, as flood receptors, and as natural harvesters of rainwater, among others. Hu et al.,1 described wetlands as the “kidneys of the earth” and “biological supermarkets” because of their critical hydrological features, rich food web, and biological diversity. The wetlands definition provided by the Ramsar Convention Secretariat2 is the most widely used in Nigeria. According to the convention, wetlands are “areas of marsh, fen, peat-land or water, whether natural or artificial, permanent or temporary, with water that is static or flowing, fresh, brackish or salt, including areas of marine water, the depth of which at low tide does not exceed 6m. In Nigeria, wetlands are estimated to cover about 28,000 km2, about 3 % of the country's 923,768 km2 land surface area”.3
Wetlands which are land areas covered with water or where water is present at or near the soil surface all year or varying periods of the year Obiefuna, Nwilo, Atagbaza, and Okolie4 could change in terms of spatial extent and the species diversity of the fauna and flora deriving their livelihood from the wetland ecosystem. The water management problem in Nigeria is that wetlands that naturally recharge and protect surface and groundwater resources are being unsustainably degraded at a rather alarming rate.3
Besides, Ayinde et al.,5 opine that a poor understanding of the economic values of wetlands is one of the contributory factors that make people see wetlands as wastelands, culminating in massive destruction of this highly productive resource. Most importantly, poor development control in urban areas has created significant problems for existing tropical wetlands. Obiefuna et al.,4 reported that more than 50% of the world’s population currently resides in cities and urban settlements. UN-Habitat6 noted that urbanisation rates were expected in developing and least-developed countries. Zhang et al.,7 also reported that 95% of the net increase in global population would be in cities of the developing world. Activities leading to industrialisation and urban development are land clearing and land reclamation, which often result in the loss of wetlands.
In Africa, wetlands are significant features, covering about 16 per cent of the continent, with estimates of about 5.6 million km2. Likewise, the wetlands in Sub-Saharan Africa are characterised by coastal wetlands, inland basins, rivers, valleys and floodplains, which cover an area of 2.4 million km2.8 Ramsar Convention2 reported the findings of the Assessment Report of the Intergovernmental Science-Policy Platform on Biodiversity and Ecosystem Services that 75 per cent of the earth’s land has been degraded and wetlands have been hit the hardest, with 87 per cent lost globally in the last 300 years. This undermined the well-being of 3.2 billion people as wetlands have become decertified, polluted, deforested or converted for agricultural production, thus gearing species extinction and other attendant issues (Ramsar Convention, (2018). Fortunately, in the past 40 years, more than 476,000 acres of wetlands have been protected through the Ramsar Convention treaty.
Between 1990 and 2020, about 30.5% of the wetland ecosystem has been lost to physical development in various forms.9 According to the National Population Commission (NPC, 2006), the population of Port Harcourt City Local Government Area alone (within its municipal boundary) grew from 7,000 residents in 1921 to 703,420 persons in 1991, indicating an increase of 696,420 persons in 70 years. Using the exponential projection model with a 6.5% annual growth rate, the projected population of Port Harcourt City LGA in 2022 is 4,955,102 persons. This dramatises an unprecedented phenomenal growth of the city’s population over the years.9
Study area
Obio/Akpor LGA is a dynamic region with a complex interplay of natural and human factors. Understanding the specific impacts of human activities on its wetlands is crucial for developing strategies that balance development with environmental sustainability. The terrain of Obio Akpor is characterised by its low-lying topography typical of the Niger Delta, with numerous rivers, creeks, and swamps crisscrossing the area. The region is rich in wetlands, which include mangroves, freshwater swamps, and tidal flats. These wetlands are integral to the hydrological system, influencing water flow and quality.
Obio/Akpor Local Government Area (LGA) is in Rivers State, Nigeria, within the Niger Delta region. It is in the southeastern part of Nigeria and shares borders with Port Harcourt City to the west, Eleme LGA to the east, and Ikwerre and Oyigbo LGAs to the north. The LGA lies approximately between latitudes 4.85°N and 4.95°N and longitudes 6.90°E and 7.05°E.
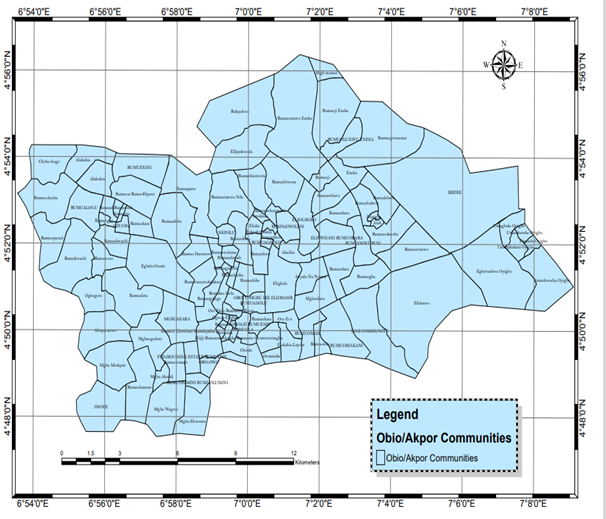
The study area experiences a tropical monsoon climate with two distinct seasons: the wet season (April to October) and the dry season (November to March). The wet season is marked by heavy rainfall, high humidity, and flooding, significantly impacting the wetlands. The dry season is characterised by lower rainfall and higher temperatures. The major vegetation types are the thick mangrove forest, raffia palms, and light rainforest. Due to high rainfall, the soil in the area is usually sandy or sandy loam Figure 1.

Figure 1 Obio/Akpor Local Government Area showing the various communities in the study area.
Source: Department of Urban and Regional Planning, Rivers State University (2024)
Concept of wetland
Wetlands are a critical subsystem of the general ecosystem as they are vital in sustaining the earth's surface and groundwater resources. There are several definitions of wetlands and shades of opinions on the concept. Ramsar Convention in 1971 defined wetlands as areas of marsh, fen, peat land or water, whether natural or artificial, permanent or temporal, with water that is static or flowing, fresh, brackish or salty, including areas in which at low tide water level does not exceed six meters. Ajibola et al.,10 defined wetlands as land interposed between terrestrial and aquatic systems where the water table is usually at or near the water table, and the land is covered by shallow water and has one or more of the under-listed attributes:
Similarly, Kadziya and Chikosha (2013), in their study of the relationship between wetlands and urban growth in Bindura, Zimbabwe, assert that wetlands are lands where saturation with water is the dominant factor determining the nature of the soil development, types of soil development and the types of plant and animal community living in the soil and on its surface, and generally include swamps, marshes, bogs and similar areas.
Simple economics signifies that relative scarcity of resources is the primary cause of wetland ecosystem losses because of the conversion of wetlands to other uses such as agriculture. It is similar to those wetlands whose water has been diverted to supply other needs, biota that have been extensively modified or harvested, and those whose capacity to absorb wastes has been overburdened or bypassed.11
In their study, Lonson and Mazzarese12 assert that conserving wetlands is often associated with forgone opportunities representing the benefits forgone from probable substitutes or uses of wetlands. Besides, going ahead with these alternative activities often results in the opportunity costs of forgone benefits that would have been otherwise derived from the conserved wetlands. Therefore, evaluating and quantifying the benefits of conservation makes them comparable with the returns derived from alternative uses to facilitate improved collective decision-making in wetland protection versus development conflict situations.
Growing threats to wetlands
According to Olusola, Muyideen and Ogungbemi,13 there is a significant variance between wetland loss and wetland degradation because wetland loss represents the outcome of the conversion of wetland areas into non-wetland areas caused by anthropogenic actions. These activities also entail building factory buildings, dredging rivers, using agricultural land, and boating. Others include industrial activities like the construction of marinas, oil and gas exploration, mining of natural resources, lumbering, and rapid uncontrolled urbanisation.14,15
Rapid uncontrolled urbanization has been a significant threat to wetlands because as cities develop, rural areas in the urban fringes experience urban influences with an increased demand for land. Wetlands that are habitats for biodiversity are continually being lost to urbanisation, and species in wetlands have become endangered with foreign species introduced into the environment.16 Wetlands are not only being threatened, but they also become a threat to urban security in Port Harcourt municipality as the reclamation and conversion of these wetlands are undertaken and controlled by community groups and rival urban gangs, community groups in addition to forced economic migrants who see those wetlands as an opportunity for territorial expansion. Thus, residents and visitors are cautious in most reclaimed and converted wetland settlements.16
Landscape ecology
Landscape ecology is the science of studying and improving the relationship between spatial patterns and ecological processes in a landscape on multiple scales. Landscape ecology studies the structure, function, and dynamics of landscapes of different kinds, including natural, semi-natural, agricultural, and urban landscapes. Landscape ecology is an interdisciplinary field that aims to understand and improve the relationship between spatial patterns and ecological processes on a range of scales. First, landscape ecology provides a hierarchical and integrative ecological basis for dealing with issues of biodiversity and ecosystem functioning from fine to broad scales. Second, landscape ecology has developed several holistic and humanistic approaches to studying nature-society interactions. Third, landscape ecology offers theory and methods for studying the effects of spatial configuration of biophysical and socioeconomic components on the sustainability of a place. Fourth, landscape ecology has developed a suite of pattern metrics and indicators which can be used for quantifying sustainability in a geospatially explicit manner. Fourth, landscape ecology has developed a suite of pattern metrics and indicators used for quantifying sustainability in a geospatially explicit manner. Finally, landscape ecology provides theoretical and methodological tools for scaling and uncertainty issues fundamental to most nature-society interactions (Wu, 2015).
Previous studies
Wetlands represent lands transitional between terrestrial and aquatic ecosystems where the water table is usually at or near the surface or the land is covered by shallow water. Wetlands are areas where water is the primary factor controlling the environment and the associated plant and animal life. They occur where the water table is at or near the land's surface or where the land is covered by shallow water (Ramsar, 2004). Wetlands are estimated to cover about 4 to 6% of the world’s land.17 Wetlands have historically been regarded as wastelands, which harbour disease vectors. Therefore, they were regarded as an obstacle to human development, leading to large-scale drainage and conversion for alternative uses without regard to ecological and socioeconomic values.17 Wetlands continue to decline globally, both in area and in quality. As a result, the ecosystem services that wetlands provide to society are diminished.18 The current distribution and extent of wetlands no longer coincide closely with those that previously existed; the conversion and loss of wetlands have seen significant changes in the area and ecological condition of many wetlands.19
Lack of adequate knowledge and awareness of the social, economic and ecosystem benefits of wetlands and the increasing demand for agricultural land due to population pressure and degradation of upland areas are believed to be the most significant reasons for the increased conversion of wetlands to agricultural lands.20 Urbanisation is recognised as a major driver of amphibian declines globally. Features promoting local amphibian populations must be identified to maintain urban biodiversity. The construction of stormwater ponds is a valuable tool for mitigating wetland loss and retaining water runoff from impermeable urban surfaces, yet their value as breeding habitat for amphibians that require both terrestrial and aquatic habitats to persist remains poorly known (Scheffers & Paszkowski, 2013).
The study utilised both primary and secondary sources of data. The research approach was mixed-methods research employing the cross-sectional survey research design. Obio/Akpor is the study area for this research. The local government area had a total population of 263,017 persons in 1991 within the municipality, according to the National Population Commission (NPC, 1991). Purposive sampling technique was used to choose five (5) communities out of the 88 communities because of their similarities in environmental issues, social and economic concerns, and they include Ogbogoro, Rumukpokwu, Nkpolu-Rumuigbo, Rumuodomaya and Rumuekini. The study population from the five (5) selected communities consisted of 177,825 inhabitants, which was exponentially projected by the 1991 National Population Commission using a 6.5% annual growth rate. A sample size of 399 respondents was obtained using Taro Yamene21 formula. The results are presented using Tables to enhance understanding Table 1.
|
S/N |
Communities |
1991 Census Population |
2023 Population Projection |
Households Size (6) |
Number of Questionnaires to Administer |
|
1 |
Ogbogoro |
9,360 |
70,200 |
11,700 |
157 |
|
2 |
Rukpokwu |
3,062 |
22,965 |
3,827 |
52 |
|
3 |
Nkpolu-Rumuigbo |
1,660 |
12,450 |
2,075 |
28 |
|
4 |
Rumuodomaya |
4,548 |
34,110 |
5,685 |
77 |
|
5 |
Rumuekini |
5,080 |
38,100 |
6,350 |
85 |
|
Total |
23,710 |
177,825 |
29,637 |
399 |
Table 1 Study Population and Sample Size
Source: Researchers’ computation (2024).
Extent of Wetland Loss and Degradation Due to Human Activities between 1990-2020
The extent of wetland loss and degradation due to human activities between 1990-2020 was ascertained, and the results are shown below. Landsat imagery from 1990 to 2020 was obtained and analysed using GIS Geographic Information System software analytical techniques, specifically ArcGis10.4. Through the spatiotemporal analysis of land use change spanning from 1990 to 2020 utilising time series techniques, notable alterations in wetland loss and degradation resulting from human activities have been identified in the study area. This analysis is presented in Table 2.
|
Land Use |
Area Covered in Square Meters |
Percentage Coverage (%) |
||||||
|
1990 |
2000 |
2010 |
2020 |
1990 |
2000 |
2010 |
2020 |
|
|
Built up areas |
39092880.29 |
71947990.55 |
112,330,051.91 |
141,841,267.96 |
14.93 |
>27.48 |
>42.91 |
54.18 |
|
Vegetation |
187,334,301.66 |
163,579,179.10 |
134,197,339.14 |
105,984,889.13 |
71.56 |
<62.48 |
<51.26 |
<40.48 |
|
Wetlands |
35,352,402.05 |
26,252,414.35 |
15,252,192.95 |
13,953,426.91 |
13.5 |
<10.02 |
<5.82 |
<5.33 |
Table 2 Land use Change between the Years 1990, 2000, 2010 and 2020 in Obio/Akpor LGA
Source: Researchers’ Field Survey, 2024
Land Use Change as of 1990
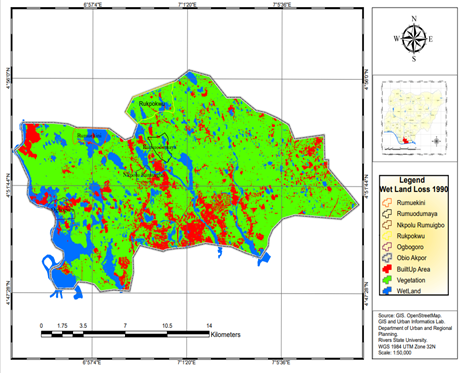
The time series analysis indicates that the wetlands remain inactive with no observed loss over the analysed period. The analysis in Table 3 shows that as of 1990, wetlands still had an area coverage of 35,352,402.05m2 intact. This indication suggests that there has been no decline or degradation in the wetlands' condition during the period under scrutiny Figure 2.
|
Land Use |
Area Covered in Square Meters |
Percentage Coverage (%) |
||||||
|
1990 |
2000 |
2010 |
2020 |
1990 |
2000 |
2010 |
2020 |
|
|
Built up areas |
39092880.29 |
71947990.55 |
112,330,051.91 |
141,841,267.96 |
14.93 |
>27.48 |
>42.91 |
54.18 |
|
Vegetation |
187,334,301.66 |
163,579,179.10 |
134,197,339.14 |
105,984,889.13 |
71.56 |
<62.48 |
<51.26 |
<40.48 |
|
Wetlands |
35,352,402.05 |
26,252,414.35 |
15,252,192.95 |
13,953,426.91 |
13.5 |
<10.02 |
<5.82 |
<5.33 |
Table 3 Land use changes between the Years 1990, 2000, 2010 and 2020 in Obio/Akpor LGA
Source: Researchers’ Analysis (2024)

Figure 2 Spatiotemporal Analysis of Land Use Change of Obio/Akpor Local Government Area in 1990.
Source: Researchers’ Analysis (2024)
Land Use Change as of 2000
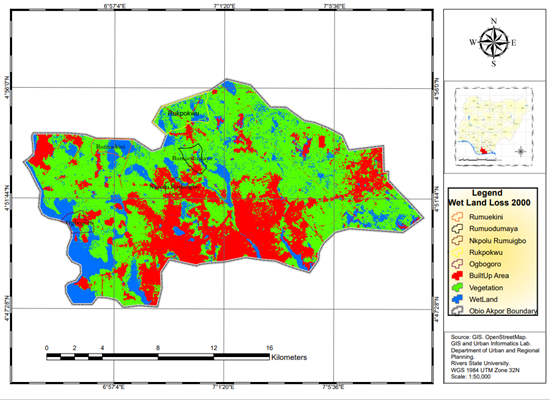
Again, the land use change of the year 2000 was also ascertained through time series analysis of data obtained from satellite imagery using Geographic Information System (GIS) software analytical techniques ArcGis10.4. The spatiotemporal analysis revealed that in 2000 as shown in Table 3. Significant alteration in the amount of wetland area that has been lost. Changed in Area Coverage in 2000 having 26,252,414.35m2, indicating a significant change of 9,099,987.70m2.This implies that greater portions of available wetland amounting to 9,099,987.708m2, about <10.02% area coverage, have been lost between 1990 -2000 in the study area Figure 3.

Figure 3 Spatiotemporal Analysis of Land Use Change of Obio/Akpor Local Government Area in 2000.
Source: Researchers’ Analysis (2024)
Land Use Change as of 2010
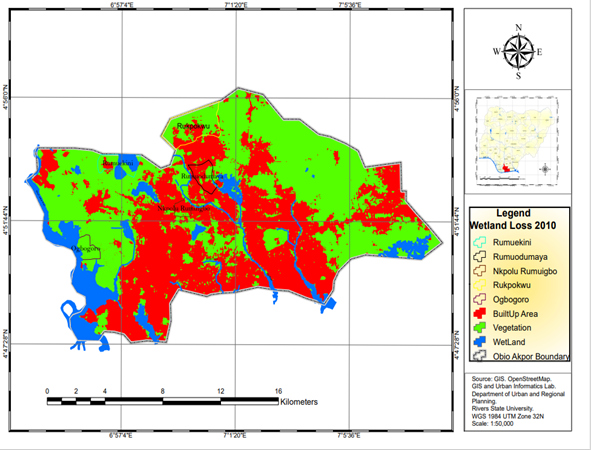
Once more, the data for 2010 was determined by analysing satellite imagery over time. The spatiotemporal analysis of 2010 satellite imagery uncovered the degree of wetland loss and depletion due to human activities and degradation. The analysis indicates a notable alteration in area coverage in 2010, with a total of 15,252,192.95m2 and a considerable change of 11,000,221.40m2, as shown in Table 3. It means that in 2010, there was a significant change in the area of wetlands, which is <5.82% substantial loss attributed to human activities, as shown by the difference in area coverage compared to previous years in the study area. These anthropogenic actions have caused phenomenal environmental changes adjoining these wetlands, leading to massive annual flood events, which supports the assertion Figure 4.

Figure 4 Spatiotemporal Analysis of Land Use Change in Obio/Akpor Local Government Area in 2010.
Source: Researchers’ Analysis (2024)
Land Use Change as of 2020
Again, satellite imagery of the study area in 2020 was also ascertained, and a time series analysis was carried out using the Geographic Information System (GIS) software analytical techniques ArcGis10.4. The spatiotemporal analysis of the 2020 satellite imagery revealed the extent of wetlands loss to human activities in the study area. The analysis further revealed that 2020 wetlands had area coverage of 13,953,426.91m2, as shown in Table 3, indicating a total change of 1,298,766.04m2 in area coverage with <5.33%change Figure 5.22,23
Information regarding the extent of wetland loss and deterioration caused by human activities was provided in Table 2, with corresponding analyses depicted in Figure 2–5, respectively. The analysis reveals the trend in wetland loss from 1990 to 2020. In 1990, there was zero change compared to the baseline year, indicating stability in wetland coverage; in 2000, there was a substantial increase in wetland loss with a -10.02% change compared to 1990. It suggests a significant deterioration of wetland areas due to human activities over the decade. The rate of wetland loss in 2010 accelerated further, reaching -5.82% compared to the previous years. The findings further indicate a rapid depletion of wetland areas, reflecting intensified human impacts on these ecosystems. While wetland loss continued, the change rate slowed to -5.33% in 2020 compared to the previous years. This finding indicates a slight improvement or stabilisation in wetland loss compared to the previous decade, although the overall trend still indicates ongoing degradation. Overall, the analysis highlights a concerning pattern of wetland loss over the three decades, with a significant acceleration in the 2000s followed by a slight deceleration by 2020. Efforts to mitigate human impacts on wetlands are crucial to reversing this trend and preserving these valuable ecosystems.
Recommendations
Based on the findings of this research, the following recommendations were made:
None.
The author declares there is no conflict of interest.

©2025 Ibama, et al. This is an open access article distributed under the terms of the, which permits unrestricted use, distribution, and build upon your work non-commercially.