eISSN: 2373-6372


Research Article Volume 16 Issue 1
Professor, Colleges of Medicine and Graduate Studies, University of Science Arts and Technology, USA
Correspondence: Orien L Tulp, Professor, Colleges of Medicine and Graduate Studies, University of Science Arts and Technology, Montserrat, British West Indies Msr1110, USA
Received: February 20, 2025 | Published: March 3, 2025
Citation: Tulp OL. Characteristics of gastric emptying on glycemic responses in the T2DM-SHR/Ntul//-cp (Corpulent) rat. Gastroenterol Hepatol Open Access. 2025;16(1):28-33. DOI: 10.15406/ghoa.2025.16.00603
To determine the characteristics of gastric emptying in lean, obese and obese diabetic rats measures of oral glucose tolerance (OGT) were determined and glycemic parameters of obesity and type II diabetes (T2DM) made. Fasting plasma Insulin, amylin, and markers of insulin resistance were greater in obese than in lean littermates and increased further in both young and old obese+T2DM rats. The oral glucose tolerance and glucose areas under the curve (AUCglc) were modestly impaired in obese LA/Ntul//-cp rats, with only a modest increment in the early phase (0 to +30 min post ingestion) of luminal glucose uptake. The OGT in obese+T2DM rats was markedly impaired, with additional progression in aging. The fractional AUCglc from 0 to+30 minutes was significantly increased in the obese+T2DM rats, and the acceleration in initial glycemic response of OGT was increased 6-fold in young T2DM rats, and remained greatly elevated thereafter. The initial and late post-absorptive glycemic phase of the OGT in old obese was greater than in younger obese T2DM. These results are consistent with epigenetic expression of obesity and obesty+T2DM and with dysregulation in the kinetics of gastric emptying analogous to Dumping Syndrome or Sirt1 dysregulation in the young obese-T2DM phenotype of the SHR/Ntul//-cp rats and the neurologic onset of gastroparesis in old T2DM SHR/Ntul//-cp rats. Thus, the Obese+T2DM rat is a useful model for the further investigation of the pathophysiology of T2DM as it occurs in man and animals.
Keywords: Obesity, epigenetic expression, insulin resistance, amylin, gastric emptying
Obesity and overweight conditions, separately or in concert with Type II Diabetes mellitus (T2DM), is now occurring globally with an alarming incidence throughout much of industrialized society.1-4 Disordered gastric physiology is a common observation in diabetes, including processes of both rapid emptying early in T2DM and in gastroparesis in later stages of both T2DM and in Type 1, insulin-dependent diabetes (IDDM).5 The peptide hormone amylin is co-secreted with insulin in response to meals and facilitates metabolic actions that are generally complementary to those of insulin, and both hormones become disordered in T2DM and insulin resistance.6 In addition, disordered Sirt-1 actions common to accelerated gastric emptying may also contribute to dysregulation of gastric functions including appetite in T2DM.7-9 Thus, impairments in insulin secretion and the combined regulatory functions are often mirrored with aberrations in amylin secretion and Sirt1 actions as well.6-9 Included among the various hormonal actions of amylin, the hormone normally assists with the physiologic process of gastric emptying via amylin receptors located on the antrum of the gastric epithelium, where it effectively delays the consistency and timing of gastric emptying.6 Upon activation, amylin receptors regulate the timing and transition of the acid chyme digestive from the stomach to the proximal duodenum, where the digestive can then become exposed to the luminal glucosidase and pancreatic neutralizing components and digestive enzymes. Thus, dysregulation of amylin receptor activity in concert to Sirt1 actions likely contributes to the dysregulated gastric functions in both T2DM and IDDM forms of diabetes.5-9 Moreover, the hyperinsulinemia and hyperamylinemia of obesity and T2DM contribute at least in part to the phenomena of insulin and amylin resistance as it occurs in those conditions via primary or secondary downregulation of hormone receptor activity.6 In contrast, in IDDM, the simultaneous deficiency or absence of both hormones contributes to the dysregulation of gastric emptying and processes of substrate metabolism. In later stages of T2DM and IDDM, the gradual progressive development of peripheral neuropathy may also impact gastric motility via impaired neurologic activity, thereby contributing to gastroparesis and physicochemical aspects of appetite regulation.5-7
The development of the corpulent rat strains at the NIH Division of Small Animal Genetics by Hansen enabled new insights into the genomic and physiological mechanisms that contribute to the development of obesity and obesity+T2DM.10-13 The LA/Ntul//-cp is a model of early onset obesity and insulin resistance and hyperamylinemia, while the SHR/Ntul//-cp rat model exhibits early onset obesity, hyperinsulinemia, hyperamylinemia, and T2DM.12,13 Hansen incorporated the genomic obesity resulting from the -cp trait originated from the Koletsky rat, and bred into a healthful, longevity-prone NIH (N) Lister Albany strain of unknown origin.10 Once the incorporation of the -cp trait had been established, it was followed by 12 or more breeding cycles to attain a congenic status in the newly established LA/N-cp strain, where the only prevailing trait of the new strain was the expression of the obesity trait.10-13 The -cp trait was also bred into the spontaneously hypertensive rat (SHR) in an analogous manner, and also followed by completing multiple cycles of backcrossing sufficient to establish congenic status while preserving the SHR and -cp traits in the new strain.11,12 The hypertensive trait was found to be preserved only in the lean phenotype of the SHR/N-cp rat while the T2DM developed soon after weaning in the obese phenotype of the new strain.12,13
The newly developed SHR/N-cp strain preserved the albino coat of the SHR strain, while the LA/N-cp strain preserved the agouti coat of the original NIH strain, thereby making the two strains easily distinguishable.13 Both obese phenotypes exhibit a significantly decreased lifespan due to complications of obesity and T2DM respectively when compared to their longevity-prone NIH (N) heritage.10 The addition of the [//tul-cp] identifier in the tul nomenclature that was later assigned by the NIH to clarify the current distinctive sub-colony of these strains that may have evolved from different backcrosses or sub-colonies reared elsewhere.14 Thus, the purpose of the present study was to characterize the expression of the obese and obese+T2DM traits in the development of T2DM and its impact on gastric emptying and glycemic parameters when reared under identical conditions of diet and environment.
Groups of male lean, obese, and obese-T2DM rats were obtained from the breeding colony at 4 months of age (n = 8 rats/group) plus an additional group (N = 5 rats) of aging male obese-T2DM rats aged rats (12 months of age). All animals were maintained since weaning under standard laboratory conditions (20-22 degrees C, ~50 % RH, on a reverse light cycle (dark 0800-2000 hrs) on standard Purina Rodent chow and house water, ad libitum. After a brief (4 hr) food restriction in the forenoon hours, rats were administered a 5-point oral glucose tolerance (250 mg/0.1 kg bW, via a slow, gentle gavage within a ~one minute duration. Bloods were obtained in heparinized microcapillary tubes for blood glucose via tail bleeding at time zero, +30, +60, +90 and +120 minutes post-gavage. In addition, fasting bloods were also obtained via a similar fashion for determination of blood insulin, amylin, and glycated hemoglobin concentrations. The Area under the glucose curve was determined via the method of Sagakichi et al.15 and computed for the OGT, and for Phase I (0 to +30 minutes post gavage), Phase II (30 to 60 minutes post gavage), and Phase III (60 to 120 minutes post gavage of the OGT. Data were analyzed via standard statistical procedures including descriptive analysis, ANOVA, and trend analysis.16,17 The study was approved by the Institutional Animal Care and Use Committee.
The effects of strain and phenotype (lean vs Obese vs Obese+T2DM) are depicted in Figure 1 and indicate that the final body weights of the obese, non-diabetic LA/Ntul//-cp rats were significantly greater than their lean littermates at 4 months of age, despite having been of similar body weights upon weaning (~45±3 g for both genders at weaning; 159 ± 4 vs 227 ± 6 g at 6 weeks of age).18 The final body weight of the obese T2DM-SHR/Ntul//-cp rat were similar to those of the non-diabetic LA/Ntul//-cp strain at 4 months of age, and increased approximately 50% further at 12 months of age (p = < 0.05). The effects of strain and phenotype on fasting blood glucose are depicted in Figure 2 (Left Panel) and indicate that fasting glucose concentrations of obese tended to be only modestly greater than their lean littermates, while the fasting glucose concentrations in both young and old SHR/Ntul-cp rats were significantly elevated. P = n.s., trend only lean vs obese; p = < 0.05 in obese-T2DM SHR/Ntul//-cp rats at both ages compared to nondiabetic obese animals. Of interest, only both age groups of Obese-T2DM SHR/Ntul//-cp rats demonstrated 4+ glycosuria in random urines, while glycosuria in obese LA/Ntul//-cp rats was not detected. The effects of strain and phenotype on glycated hemoglobin are depicted in the right panel of Figure 2, and indicate that the percent glycated hemogobin indicated a significant trend only in the obese, non-diabetic rats, while the percent glycated hemoglobin in both obese-T2DM groups was significantly greater than either of the non-diabetic groups, reflective of a greater mean 24-hour plasma glucose concentration during the preceding weeks and months in those animals.
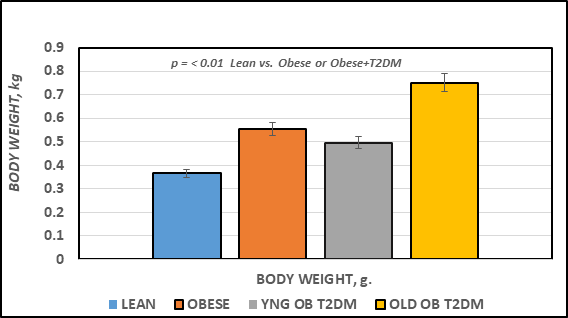
Figure 1 Final body weights of rats. Data are mean ± 1 SEM, n = 5-8 rats/group.
P = < 0.01 for lean vs obese, and lean vs Obese+T2DM at both ages represented.
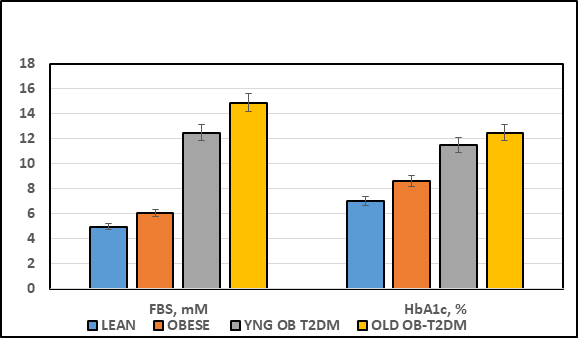
Figure 2 Effect of strain and phenotype on Fasting Blood Glucose and percent Glycated Hemoglobin (HbA1c) of rats. Data are mean ± 1 SEM, n = 5-8 rats/group. P = < 0.05 for lean vs obese, and lean vs Obese+T2DM for FBS; p = < 0.01 for HbA1c lean vs Obese+T2DM at both ages represented. Glucose expressed a mM and HbA1c as percent of hemoglobin.
The effects of strain and phenotype on fasting plasma insulin and amylin hormones and the insulin to glucose ratio as an indicator or insulin resistance are indicated in Figure 3A. Fasting plasma insulin and amylin concentrations were significantly greater in the obese than their lean littermates at 4 months of age (p = < 0.05), and were significantly greater yet in the obese-T2DM rats of both ages, with the greatest plasma concentrations noted in the oldest obese-T2DM rats studied (p = < 0.01 Obese+T2DM vs obese or lean). The insulin to glucose ratios are depicted in the far right panel of Figure 3, and indicate that the insulin to glucose ratio was similarly increased in all obese animals of both strains (p = < 0.05). The effects of strain and phenotype on HOMA21 are depicted in Figure 3B, and indicate that the HOMA values as an additional indicator of insulin resistance of the obese rats tended to be only modestly greater than their lean littermates, while the HOMA of the obese+T2DM rats of both younger and older SHR/Ntul//-cp rats were significantly greater than both non-diabetic groups, with the greatest values observed in the oldest obese+T2DM group, consistent with and confirming the development of significant insulin resistance in these two groups.
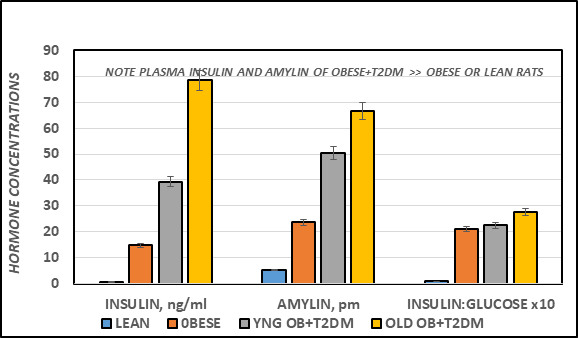
Figure 3A Effect of strain and phenotype on Fasting plasma Insulin, Amylin and Insulin: Glucose ratio of rats. Data are mean ± 1 SEM, n = 5-8 rats/group. P = < 0.05 for lean vs obese, and lean vs Obese+T2DM for all parameters.
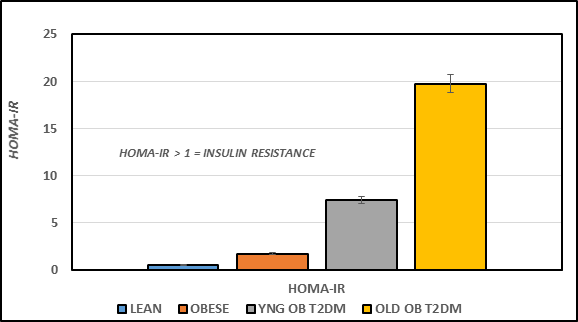
Figure 3B Effect of strain and phenotype on HOMA of rats. Data were computed from fasting plasma glucose and insulin concentrations and are the mean ± 1 SEM, n = 5-8 rats/group. P = < 0.05 for lean vs obese, and lean vs Obese+T2DM.21
The effects of strain and phenotype on oral glucose tolerance (OGT) are depicted in Figure 4A, and indicate that the glycemic response to a standard oral glucose challenge was only modestly impaired in the obese LA/Ntul//-cp rats, although overall the differences between the lean and obese littermates were significant from the 30 minute time points (p = < 0.05). In contrast, the glycemic responses in both obese-T2DM SHR/Ntul//-cp groups were markedly impaired, with typical plasma glucose concentrations more than twice those of the non-diabetic obese or lean rats at all time points measured. In addition, the glycemic excursions in the 12 month-old group continued to increase throughout the OGT, while the glycemic responses in 4-month old diabetic rats began to return toward pre-OGT concentrations, consistent with a lesser magnitude of insulin resistance in the younger groups. Of interest, the upward slope of the increase in plasma glucose concentrations from time zero to 30 or zero to 60 minutes time point was significantly greater in obese+T2DM groups than in non-diabetic obese or lean animals.
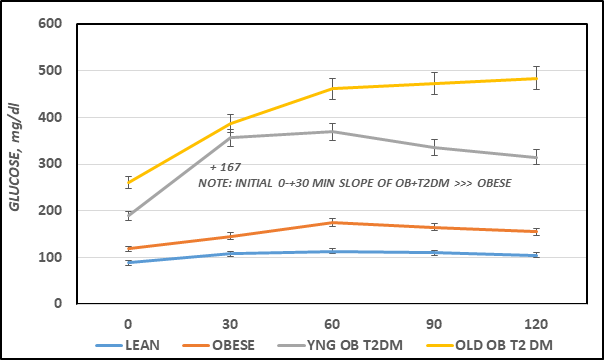
Figure 4A Effects of strain and phenotype on oral Glucose Tolerance Test (OGT). Data are the mean ± 1 SEM, N=5-8 rats/group. The numbers above and below each OGT curve represent the mean increment or decrease at each phase of the OGT. The numbers below the figure represent the time in minutes since gentle post-glucose gavage.
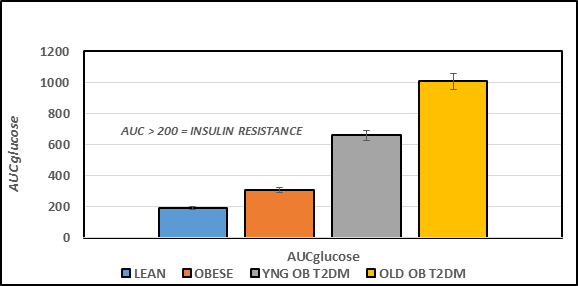
Figure 4B Effect of strain and phenotype on AUC glucose of rats. Data are mean ± 1 SEM, n = 5-8 rats/group. P = < 0.05 for lean vs obese, and lean vs Obese+T2DM. The data are consistent with insulin resistance obese rats, and the magnitude of insulin resistance was greater in the obese+T2DM than in the obese non-diabetic rats.
The Area under the glucose curves is depicted in Figure 4B and indicates that the AUCglc of obese > lean, and the AUCglc obese+T2DM was ~ twice than that observed in the non-diabetic obese animals, and approximately 3-fold greater in aging obese+T2DM animals than in non-diabetic obese LA/Ntul//-cp rats. When the Area under the curve was divided into luminal absorptive phase (Phase 1 = 0-30 minutes post glucose ingestion), Intermediate phase (Phase 2 =30-to 60 minutes post ingestion), and peripheral uptake phase (Phase 3 = 60 to 120 minutes), it was noted that the initial increments in Phase 1 and Phase 2 of obese were moderately greater than occurred in their lean littermates (left panel, Figure 4C) and markedly greater yet in both obese+T2DM groups (Figure 5A). This observation is consistent with an accelerated rate of gastric emptying typical of T2DM, particularly in the obese+T2DM rats. Phase 3 of the OGT response indicated that the rate of uptake in peripheral tissues typical of post-Phase 1 and 2 uptake, exhibited a decline by 120 minutes after glucose administration and occurred normally as predicted in lean, obese, and younger obese animals (Figure 5B). In contrast, in older obese T2DM rats, however, the Phase 3 plasma glucose concentrations continued to increase throughout the OGT, consistent with a greater magnitude of insulin resistance and gastric dysfunction in animals with advanced stigmata of T2DM. The directional increments in the OGT in each groups for phases 1 and phases 3 are depicted in Figure 4D, and reflect graded increments in the magnitude of plasma glucose increased progressively in each group from Control lean, obese littermates, young obese+T2DM, and old obese-T2DM rats. The results of the glycemic excursion in Phase 3 exhibit a progressive downward pattern in lean, obese littermates, and similar aged young obese+T2DM rats, all with a final plasma glucose that was decreased from the 60 minute peak response in the OGT. In contrast, in older obese+T2DM rats the 120-minute glucose concentrations were greater than the 60 minute peak glycemic responses typical of the other groups, consistent at least in part with delayed glucose disposal secondary to a greater magnitude of insulin resistance in peripheral tissues in older than occurred in younger animals of both obese groups also consistent with the impact of the elevations in plasma insulin and amylin concentrations and their contributions to the gastric emptying reflex.6
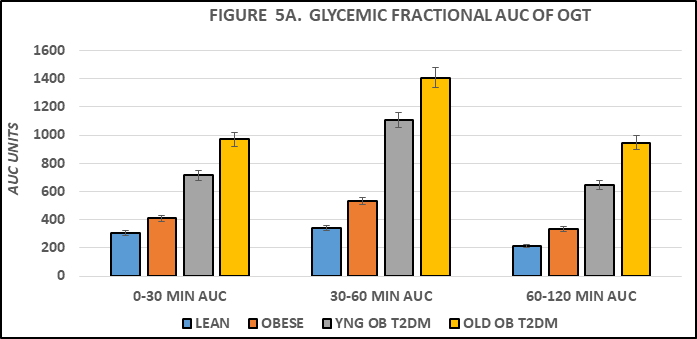
Figure 5A Effect of strain and phenotype on AUC glucose OGT phase fractions of rats. Data are mean ± 1 SEM, n = 5-8 rats/group. P = < 0.05 for lean vs obese, and lean vs Obese+T2DM. The data are consistent with accelerated gastric emptying in obese and obese+T2DM rats, and with delayed peripheral glucose uptake in old obese+T2DM rats, suggestive of the neurologic onset of gastroparesis.
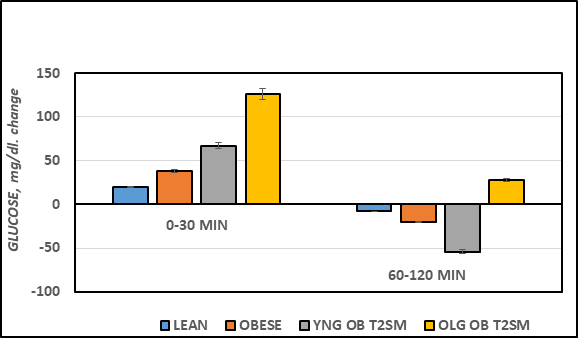
Figure 5B Effect of strain and phenotype on plasma glucose increment or decline during OGTT of rats. Data are mean ± 1 SEM, n = 5-8 rats/group. P = < 0.05 for lean vs obese, and lean vs Obese+T2DM for all parameters. Note the 60-120 minute decline in plasma glucose for Lean, Obese, and young Obese+T2DM rats, in contrast to the net additional increase (+23 mg/dl) in plasma glucose concentrations in the old obese+T2DM rats.
The results of this study indicate that the disordered characteristics of gastric emptying and peripheral glucose disposal occurred in congenic obese and obese diabetic rats. These observations are consistent with obesity- and obesity+T2DM-induced insulin resistance and dysregulation of gastric emptying that occurred in the obese phenotype of the SHR/Ntul-cp rat. The non-diabetic strain demonstrated a substantially lesser magnitude of gastric dysfunction and disordered glucose uptake than the obese phenotype of the diabetic SHR/Ntul//-cp strain, including lesser degrees in the magnitude of insulin and amylin resistance. Dysregulation of gastric emptying, in concert with obesity and overweight conditions and insulin resistance in peripheral tissues are common observations in obesity+T2DM.5 The pathophysiology of the disordered gastric function is presumed to result at least in part from hormonal insensitivity to amylin, an endocrinologic regulator of gastric emptying, in concert with peripheral neuropathy that may impact neurologic activation of gastric emptying and gastroparesis in advanced stages of T2DM.5,6 The similarity in elevations in plasma insulin and amylin concentrations among the obese animals of this study were of interest, in that earlier reports indicate that the two hormones are cosecreted in response to meals.6 The physiologic functions of the hormones facilitate substrate uptake and glycogen regulation in peripheral tissues, in addition to the well established amylin induced modulation of gastric emptying.22,23 The gastric amylin actions are exerted in the antrum of the stomach, where they gate the timing and transfer of acid chyme into the duodenum following the gastric phase of digestion. Once the acid chyme enters the upper echelons of the duodenum, the partially digested starches undergo enzymatic cleavage into monosaccharides including free glucose, followed by rapid glucose uptake into the circulation. Virtually an entire glucose meal would be expected to undergo complete luminal absorption within 30 minutes upon entry into the duodenum under normal circumstances, while other monosaccharides may undergo luminal absorption more slowly.5
Measures of oral glucose tolerance were determined and glycemic parameters of obesity and type II diabetes (T2DM) made using a standardized dose of a 50% glucose solution, equivalent to 250 mg/0.1 kg BW, via gentle gavage, and as has been administered in numerous previous studies.12,15 In cases of accelerated gastric emptying, the administered glucose would be likely to enter the duodenum sooner than in non-diabetic rats, resulting in faster luminal absorption, and in a greater slope in Phase I and phase 2 of the OGR response. Indeed, the Phase I slope in obese rats was 1.5-fold steeper than in lean littermates and was 9-fold greater in the younger obese+T2DM SHR/Ntul//-cp rats and 7-fold greater in the older obese+T2DM rats with a continued upward slope throughout the duration of the OGT. Thus, the observations in the younger obese+T2DM rats are consistent with an accelerated rate of gastric emptying in concert with insulin and likely amylin resistance, while in the old obese+T2DM rats, the results imply both disordered gastric emptying and delayed peripheral glucose uptake, indicative of the onset of neurologic deficits in combination with amylin resistance, and typical of that which is often observed in advanced stages of uncontrolled T2DM.5,6 The effects of obesity, insulin resistance and T2DM have also been found to impair the expression and actions of the inulin-dependent GLUT4 glucose transporters in peripheral tissues, as additional contributors to insulin resistance and impaired glycemic responses to carbohydrate uptake and oxidation in peripheral tissues.19,20,22 In other studies, amylin analogues have been explored as adjuncts in treatment of diabetes.23 Accordingly, the current animal models provide an excellent physiologic model to investigate the glycemic and metabolic attributes of T2DM as it occurs in man and animals.
No study of aging or gastric dysregulation would be complete without a brief discussion of Sirtuin peptides and their likely contributions to epigenetic regulation of aging, gastrointestinal, metabolic and inflammatory functions. The sirtuins represent a recently discovered class of NAD+ deacetylases (n = 7 at last count) that function as silent epigenetic-linked information transfer factors in multiple tissues.7-9 The sirtuins are dependent upon generation of cellular NAD+ derived from substrate metabolism and facilitate the deacetylation reactions. Sirtuin 1 is associated with the regulation of both gastric emptying and thyroid hormone activation, and their impact on aging. As such, both functions are likely contributors to the development of obesity and T2DM respectively as they occur in the Corpulent rat strains. Lysine and possibly other amino acid residues of chromatin-based histones and other cellular proteins are the primary targets of sirtuin actions. Their cellular actions culminate in contributions to the regulation of epigenetic, genomic expression in multiple tissues following the deacetylation reactions.7-9 The deacetylation reactions occur in response to nutritional and environmental signals likely transmitted via neural signals that likely originate in hypothalamic paraventricular nuclei. The actions result in their expression in the pituitary and other tissues.7 The NAD+ availability is ultimately derived mostly from nutritional and environmental status and recent macronutrient ingestion.24,25 Specifically, the NAD+/NADH ratios are generated via heightened nutritional and environmentally-induced metabolic and mitochondrial activity.24 Thus, over- and undernutrition are associated with the generation of Sirt1, which plays a role in regulating gastric emptying via influences on gastric motility. Sirtuins also play a role in cellular senescence and aging via regulatory actions at the level of the cell cycle.24-28 Studies indicate that increased Sirt1 activity can potentially augment the positive actions of amylin, resulting in a decrease in the rate of gastric emptying. Thus, increased actions of Sirt1 essentially contribute to a delay in the stomach's ability to empty its contents into the small intestine.5-9 In contrast, overnutrition is associated with increased expression of Sirt1 and with the repression of Sirt1 actions and is also linked to the control and actions of several antiaging genes including Klotho, p66shc, and FOXO01/FOXO3a.7-9,25-28 In addition they are also linked to disturbances in glycemic regulation via neurologic actions at the level of the suprachiasmatic nucleus (SCN). The SCN actions are of importance to pathophysiologic factors in multiple organs and tissues impacted by those genes.9
Sirtuins also contribute to the generation of inflammatory cytokines, where when activated can bring about highly damaging effects on peripheral tissues and organs as a result in a shift in M1 and M2 macrophage differentiation.29 While the M2 macrophages generate healthful, non-inflammatory protective ROS functions in peripheral tissues, the M1 macrophages result in damaging effects. The M1 macrophages generate proinflammatory M1 (iROS) actions, result in the release of inflammatory cytokines including IL-6, TNFa, and CRP, and are especially prone to occur in visceral adipose tissues. Thus, M1 macrophages contribute to the magnitude of cytokine-mediated inflammation and their eventual pathophysiologic sequelae in peripheral tissues.29,30 Nutritional contributions, derived predominantly from excess carbohydrate and other metabolizable energy sources, can bring about increases in insulinogenic activity and a decrease in sirtuin activity.33,34 The decreases in sirtuin activity including Sirt 1 can result in reciprocal increases in the activtion of T4 to metabolically active T3 and in accompanying increases in resting metabolic rates, which can also contribute to pathophysiologic effects of systemic inflammation.25-28
In addition to inflammatory M1-macrophage activity, sustained positive energy balance of overnutrition may also contribute to increases in cell cycle replication and cytokine induced DNA damage, including telomere shortening.8,26,30-33 Since longer telomere length is linked to longevity, the combined effects of overnutrition on sirtuins may thereby negatively impact potential longevity via accelerated shortening of telomere length.31-34 In contrast, fasting, undernutrition and caloric deprivation, and starvation can bring about increases in sirtuin availability, improvements in insulin sensitivity, gastrointestinal activity, and shifting from formation of T3 to reverse T3, a physiologically inactive form of the hormone.30,35-37 The caloric efficiency is notably more favorable in the obese than the lean phenotype of the corpulent rat strains, thereby facilitating fat accretion.37 Meanwhile, the effects of the epigenetically-expressed obesity are expressed differentially in different adipose tissue depots before and following changes in weight gain and adiposity.30-38 Thus, the purpose of the present study was to determine the differential effects of aging and obesity on parameters of T2DM in a congenic animal model that is highly predisposed to early onset obesity, with or without the usual comorbidities of T2DM or hypertension.
The result of this study indicate that the aberrant glycemic responses to an standard OGT in obese and obese-T2DM rats were consistent with accelerated gastric emptying in young obese+T2DM rats, in addition to glycemic responses consistent with onset of gastroparesis in combination with insulin resistance in older obese+T2DM rats. In contrast, in younger non-diabetic rats that share the same epigenetic trait for obesity (the -cp trait) exhibit moderate insulin resistance and glycemic responses that are consistent with only modestly accelerated gastric emptying, and without evidence of gastroparesis. The dysregulation of gastric emptying is consistent with impaired amylin actions on gastric emptying, while in older obese-T2DM rats the glycemic responses were consistent with the onset of gastroparesis in combination with significant insulin resistance. In addition, the origins of the genetic background hosting the epigenetic -cp trait enable greater clarity in the contributions of obesity per se and its differential role in progressing to insulin resistance and T2DM. Regardless of the pathophysiologic mechanisms involved, the glycemic characteristics of Obesity vs Obesity+T2DM were characterized in the corpulent rat, an animal model metabolically similar to the same disorders as they occur in man and animals.
The author thanks the University of Science Arts and Technology for the resources to prepare this manuscript.
The author reports no competing interests.
The author reports that no applications of AI were utilized in the generation of this manuscript.

©2025 Tulp. This is an open access article distributed under the terms of the, which permits unrestricted use, distribution, and build upon your work non-commercially.