Research Article Volume 10 Issue 1
Use of statistical models for predicting oral health status of children with cerebral palsy in Sri Lanka
HBWMDM Weerasekara,1 L.S. Nawarathna,2 
Regret for the inconvenience: we are taking measures to prevent fraudulent form submissions by extractors and page crawlers. Please type the correct Captcha word to see email ID.

E.M.U.C.K. Herath3
1Postgraduate Institute of Science, University of Peradeniya, Sri Lanka
2Department of Statistics and Computer Science, Faculty of Science, University of Peradeniya, Sri Lanka
3Division of Paedodontics, Department of Community Dental Health, Faculty of Dental Sciences, University of Peradeniya, Sri Lanka
Correspondence: L.S. Nawarathna, Department of Statistics and Computer Science, Faculty of Science, University of Peradeniya, Sri Lanka
Received: February 18, 2021 | Published: April 21, 2021
Citation: Weerasekara HBWMDM, Nawarathna LS, Herath EMUCK. Use of statistical models for predicting oral health status of children with cerebral palsy in Sri Lanka. Biom Biostat Int J. 2021;10(1):37-44. DOI: 10.15406/bbij.2021.10.00328
Download PDF
Abstract
Cerebral Palsy (CP) is the most common movement disorder in children, which is defined as ‘‘a group of permanent disorders of the development of movement and posture, causing activity limitations attributed to non-progressive disturbances occurred in developing fetal or infant brain. In this study, we consider the four most common CP types categorized by the location of movement problems named Monoplegia, Diplegia, Hemiplegia, and Quadriplegia. Oral health is a state of being free from the chronic mouth, facial pain, oral and throat cancer, oral sores, congenital disabilities such as cleft lip and palate, tooth decay and tooth loss, and other diseases disorders oral cavity. The main goal of the study is to create suitable statistical models for predicting the oral health status of children with CP using Silness-Löe plaque index and DMFT Index (DMFTI). Also, to identify the relationships between DMFTI and demographic, DMFTI and CP location, Silness-Loe plaque index and demographic data, Silness-Loe plaque index and CP location, Care index (CI) and demographic data, and the CI and CP location. This analysis was performed on a sample of 93 children with CP in the Central Province, Sri Lanka. The independent sample t-test and one-way ANOVA test were used to identify the relationship between variables, and effect sizes were calculated using partial Eta squared value to measure the strength of the relationship. Further Multiple Linear Regression (MLR) model, Random Forest Regression (RFR) model, and the Support Vector Regression (SVR) model were used to predict the oral health status using DMFTI and plaque index separately. A comparison was conducted for the fitted models using the Coefficient of determination (R-squared). There is a significant difference between the mean values of the plaque index for different CP locations. Children with diplegia have the lowest plaque index, while children with hemiplegia have the highest plaque index. The accuracy of the MLR model for predicting DMFTI is 23.60% and 20.80% for Permanent and primary teeth separately, and 20.00% for predicting Plaque Index. Those accuracies for the RFR model are 92.64%, 93.11% and 90.32%, while 95.36%, 85.65% and 80.07% for SVR model respectively. Therefore, the RFR Model was considered the best-fitted model for predicting oral health status using DMFTI and the plaque index of Sri Lankan children with CP. Besides, children with hemiplegia have a higher risk of having lower oral health status.
Keywords: oral health, cerebral palsy, multiple linear regression, random forest regression, support vector regression
Introduction
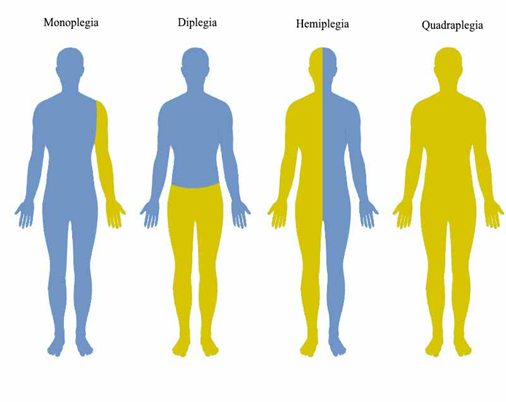
Cerebral palsy (CP) is primarily a disorder of movement and posture. It is defined as ‘‘a group of permanent disorders of the development of movement and posture, causing activity limitations, that are attributed to non-progressive disturbances that occurred in the developing fetal or infant brain’’.1 There are four major types of cerebral palsy, which are spastic, athetoid, ataxic, and mixed type. Spastic cerebral palsy is the most common type of CP, making up 70 to 80 per cent of cases. Moreover, the cerebral palsy location (CP-location) explained by the location of movement problems can be mainly categorized into four types, namely 1. Monoplegia: Only one limb movement is affected. It usually occurs in the arm or leg, 2. Diplegia: Two limbs, usually the legs, are affected, 3. Hemiplegia: One side of the body is affected, and 4. Quadriplegia: All four limbs are involved, but the legs are affected worse than the arms.2 Figure 1

Figure 1 Types of CP Locations.
Oral health is a state of being free from chronic mouth and facial pain, oral and throat cancer, oral sores, congenital disabilities such as cleft lip and palate, tooth decay and tooth loss, and other diseases and disorders affect the oral cavity. In most studies, oral health status is assessed using the Silness-Löe plaque index and Dental caries index.3 DMFT Index (DMFTI) can be obtained by calculating the total number of Decayed, Missing, and Filled Teeth in permanent dentition and primary dentition separately. The patient’s clinical oral examination was realized for the prevalence of dental caries in an individual. Silness-Löe plaque index is a measurement to state the oral hygiene recording debris and mineralized deposits in each of the four surfaces, and a score is given from 0-3.4 The Care Index (CI) is a measure of the proportion of carious teeth managed with restorations or by extraction. It is defined as CI = F+M/D + M + F, where D: the number of restored teeth as a proportion of the total number of decayed, M: missing, and F: filled teeth. It provides an epidemiological measure of how much treatment has been provided to manage the disease.5,6
The main goal of the study is to create suitable statistical models for predicting the oral health status of children with cerebral palsy in Sri Lanka. In this study, we had described two types of statistical models to predict the oral health status using DMFTI and Silness-Loe plaque index of children with CP. Also, to identify the relationships between DMFTI and demographic data of children with CP, DMFTI and CP location, Silness-Loe plaque index and demographic data of children with CP, Silness-Loe plaque index, and CP location were other objectives. Many studies have been conducted worldwide regarding oral health status7,8 and caregiver support of children with CP.9 However, only one study was conducted on the prevalence of CP in Sri Lankan children, a descriptive cross-sectional study. Therefore, this study was conducted to identify the oral health status of Sri Lankan children with CP. Besides, we introduced novel models to predict Sri Lankan children's oral health status.10
This article is organized as follows. In Section 2, we describe the nature of the data set utilized for the analysis; Section 3 contains the description of the methods used in the analysis, such as the multiple linear regression model, Support Vector Regression model, and Random forest regression model. Section 4 illustrates the results obtained using statistical software (Rstudio, IBM SPSS) and Python libraries (scikit-learn, pandas, NumPy). Section 5 includes the significant findings with the conclusions of the study.
Material and methods
Ethical approval
Ethical clearance was obtained from the Ethical Review Committee of the Faculty of Allied Health Sciences, University of Peradeniya. The permission to collect data from the respective hospitals was obtained from the hospital directors after getting the ethical clearance. Informed written consent was obtained from the participants (caregivers) before the data collection, after explaining the study's purpose.10
Data
Data were collected from 93 children with CP and their caregivers who attended the neurology clinic at Rehabilitation Hospital, Digana, and Sirimavo Bandaranayake Specialized Children Hospital, Peradeniya. Medically diagnosed children and adolescents with CP aged between 3 -18 years were included in the study, and children whom parents or caregivers did not accompany were excluded from the study.
The questionnaire consisted of five parts of demographic data of parents and the child, medical history, mother's/caregiver's awareness about oral health, Family Impact Scale, and the dental examination. The family impact was measured by calculating the Family Impact Scale uses 14 questions in the questionnaire. Oral health statuses were examined by calibrated, trained dental surgeons attached to the Faculty of Dental Sciences, University of Peradeniya. Oral health statuses were tested using the DMFT score, and Silness-Löe Index. Oral health conditions such as anterior open bite, malocclusion, trauma, high-arched palate, tongue thrust, angular cheilitis, macroglossia, drooling, erosion, and bruxism were recorded. Table 1 illustrates the description of the variables which were used in the study.
Variable |
Notation |
Description with categories |
Independent Variables |
Age |
|
Scale Variable in years |
Gender |
|
Male, Female |
Ethnicity |
|
Sinhala, Tamil, Muslim, Other |
Education level of Mother |
|
Below Ordinary Level, Up to Ordinary Level, Up to Advance Level, Degree or diploma holder |
Education level of Father |
|
Below Ordinary Level, Up to Ordinary Level, Up to Advance Level, Degree or diploma holder |
CP-Location |
|
Monoplegia, Diaplegia, Hemiplegia, Quadriplegia, Other |
Usage of toothpaste contains Fluoride |
|
Fluoride, Non-fluoride |
Brushing Frequency |
|
Once a day, twice a day, More than twice a day |
Family Impact Scale |
|
Scale Variable |
Dependent Variables |
Dental Caries Index |
|
Scale Variable |
Silness-Leo plaque index |
|
Scale Variable |
Table 1 Description of variables
Three statistical models were used to predict the oral health status using DMFTI and Plaque index. Since the dependent variables (Plaque Index / DMFTI) are numerical and are using more than two independent variables, the Multi Linear Regression (MLR) model was used as the first statistical model to predict oral health status. Since machine learning models are designed to make the most accurate predictions possible as the second and third models, Support Vector Regression (SVR) and Random Forest Regression (RFR) advanced machine learning techniques were used.11 Model accuracies were calculated using the cross-validation method by splitting the data into training data (80% from the sample) and testing data. Independent sample t-test and One-way ANOVA test were used to identify the relationship between variables.
Multiple linear regression model (MLR)
For p - 1 independent variables, the regression model can be written as,
where,
is the dependent variable of the regression model,
: the slope of the regression,
: independent variable of the regression,
: constant and
: random error. There are three main linear regression assumptions namely Homoscedasticity, Multicollinearity, and residuals should follow a normal distribution.
By checking the F-statistic or p-value in the ANOVA table, if the p-value is less than the significance level, we can reject the null hypothesis (
) and conclude that at least one value does not equal zero. In this study, the forward-selection method was used to identify the most suitable reduced model for predicting Sri Lankan children's oral health status with CP.12
Support vector regression model (SVR)
SVR gives the flexibility to define how much error is acceptable in the model and find an appropriate line (or hyperplane in higher dimensions) to fit a data set. The objective function of SVR is to minimize the coefficients .
More specifically, the l2-norm of the coefficient vector. The error term is instead handled in the constraints ,
where we set the absolute error less than or equal to a specified margin, called the maximum error, ϵ (epsilon).13 We can tune epsilon to gain the desired accuracy of our model.
Random forest regression (RFR)
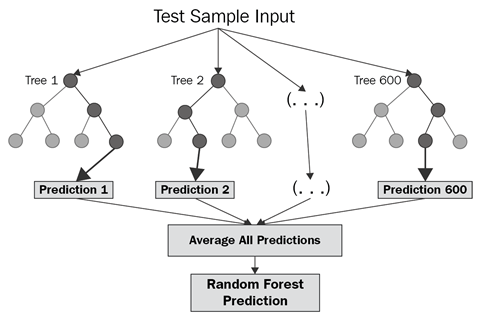
Random forests are a combination of tree predictors, such that each tree depends on the values of a random vector sampled independently and with the same distribution of all trees in the forest.14 Figure 2

Figure 2 Random Forest Regression Model from Abanto, et al. (2012)9
.
Model selection and model accuracy
The R2 value is used to measure the model accuracy. It is the proportion of the variance in the dependent variable that is predictable from the independent variables.
where
is ith observation,
is the mean value of y, and
is an estimated value for yi. Moreover, the post hoc test was used to find the differences between the groups of a categorical variable after the ANOVA test results showed that the dependent variable does not have equal means for at least two groups of the categorical variable.
Also, the Akaike Information Criterion (AIC) and Root Mean Square Error (RMSE) were used to select the best model. The smallest AIC and RMSE values suggest that the model is a better fit for the data than other models.
Result and Discussion
Table 2 shows the frequency table for demographic data associated with this study. Then, the DMFTI and Silness-Loe plaque index for all the children was calculated. DMFTI for primary teeth and permanent teeth are 3.7419±5.0064 and 0.5269±2.3847 respectively. Silness-Loe plaque index for all the children was 2.3019±0.6151 and CI was 0.0499±0.1713.
Variable |
Category |
Frequency |
Gender |
Male |
48 (51%) |
Female |
45 (48.4%) |
Ethnicity |
Sinhala |
68 (73.1%) |
Tamil |
16 (17.2%) |
Muslim |
9 (9.7%) |
Education level of Mother |
Below O/L |
31 (33.3%) |
Up to O/L |
39 (41.9%) |
Up to A/L |
17 (18.3%) |
Degree or Diploma |
5 (5.4%) |
Education level of Father |
Below O/L |
31 (33.3%) |
Up to O/L |
40 (43.0%) |
Up to A/L |
18 (19.4%) |
Degree or Diploma |
4 (4.3%) |
CP-location |
Monoplegia |
6 (6.5%) |
Diplegia |
20 (21.5%) |
Hemiplegia |
30 (32.3%) |
Quadriplegia |
28 (30.1%) |
other |
9 (9.7%) |
Brushing Frequency |
Once a day/ Occasionally |
16 (17.2%) |
Twice a day |
69 (74.2%) |
More than twice a day |
8 (8.6 %) |
Fluoride Contain |
Fluoride |
68 (73.1%) |
Non Fluoride |
25 (26.9%) |
Table 2 Frequency table for demographic data
The Effect size was calculated to measure the strength of the relationship between variables, using partial Eta Squared. Table 3 shows the relationship between dependent variables and demographic data; gender, frequency of brushing, education level of parents, and toothpaste usage containing fluoride.
Variables |
Category |
p-value |
Effect size (Partial ). ). |
DMFTI for Permanent teeth |
DMFTI for Primary teeth |
Plaque Index |
Care Index |
DMFTI for Permanent teeth |
DMFTI for Primary teeth |
Plaque Index |
Care Index |
Gender |
Male
Female |
0.093α |
0.474α |
0.323α |
0.200α |
0.031 |
0.006 |
0.011 |
0.032 |
Frequency of brushing |
once a day/occasionally
twice a day
more than twice a day |
0.572 β |
0.593 β |
0.441β |
0.525β |
0.012 |
0.012 |
0.018 |
0.025 |
Education level of mother |
Below O/L
Up to O/L
Up to A/L
Degree or diploma holder |
0.818β |
0.872β |
0.317β |
0.720β |
0.010 |
0.008 |
0.039 |
0.027 |
Education level of father |
Below O/L
Up to O/L
Up to A/L
Degree or diploma holder |
0.595β |
0.051β |
0.822β |
0.998β |
0.021 |
0.084 |
0.010 |
0.001 |
Fluoride contains |
Fluoride
Non fluoride |
0.276 α |
0.108 α |
0.838α |
0.274 α |
0.013 |
0.028 |
<0.001 |
0.023 |
CP Location |
Monoplegia
Diplegia
Hemiplegia
Quadriplegia
Other |
0.691β |
0.413β |
0.008β |
0.592β |
0.025 |
0.043 |
0.143 |
0.055 |
Table 3 Relation between dependent variables and demographic data
‘α' indicates that the p-value was obtained using the independent sample t-test and similarly, ‘β’ indicates that the p-value obtained using one-way ANOVA (at significant level = 0.05). Since all the p-values for DMFTI of both permanent teeth and primary teeth; and Plaque index are greater than the significant level (0.05), there is no significant difference between the mean values of the dependent variable (DMFTI – permanent, Plaque index) for each demographic variables. Also, all the partial Eta squared values are less than 0.14,15 and hence no prominent effect on dependent variable from demographic data was observed.
According to Table 4, since the p-value of one-way ANOVA for DMFTI are greater than the significance level (0.05) no significant difference between mean values of DMFTI for all five categories of CP location were detected. A significant difference between mean values of Silness-Loe plaque index among the five categories of CP location for the plaque index was found. That implies that at least one group is different from other groups. To find which group/groups are different from which other groups, the Post Hoc Test was used. The partial Eta squared value for the relationship between CP location and Plaque index is greater than 0.14. Therefore we can conclude that CP location has a significant effect on the Plaque index.
CP Location |
Monoplegia |
Diplegia |
Hemiplegia |
Quadriplegia |
Other |
Monoplegia |
- |
0.967 |
0.429 |
0.879 |
0.989 |
Diplegia |
0.967 |
- |
0.003 |
0.104 |
0.636 |
Hemiplegia |
0.429 |
0.003 |
- |
0.688 |
0.663 |
Quadriplegia |
0.879 |
0.104 |
0.688 |
- |
0.992 |
Other |
0.989 |
0.636 |
0.663 |
0.992 |
- |
Table 4 Summary p-values obtained from the Post Hoc Test
Table 4 shows the summary p-values obtained from the post hoc test results. p-value between Diplegia and Hemiplegia is less than 0.05. Therefore, a significant difference between the mean of the plaque index among Hemiplegic and Diplegia.
Multiple linear regression model (MLR)
For the MLR models, all three full models are significant at 95% confidence level. The fitted three MLR models are as follows.
Table 5 shows the p-values of each predictor variable for three dependent variables separately. For the first dependent variable (DMFTI-Permanent Teeth), two parameters related to age and family impact scale variables are significant.
Variables |
Parameter |
DMFTI-Permanent Teeth |
DMFTI-Primary Teeth |
Plaque index |
Intercept |
|
0.01645 |
0.833553 |
0.19190 |
|
|
0.00019 |
0.000231 |
0.23170 |
|
|
0.22414 |
0.821849 |
0.18554 |
|
|
0.01752 |
0.656532 |
0.17828 |
|
|
0.93699 |
0.486471 |
0.11180 |
|
|
0.62004 |
0.210073 |
0.80143 |
|
|
0.24836 |
0.657163 |
0.11621 |
|
|
0.85802 |
0.659345 |
0.76809 |
|
|
0.89809 |
0.329756 |
0.60748 |
|
|
0.10603 |
0.002157 |
0.00266 |
Table 5 p- values for MLR model coefficients
Lastly, a stepwise selection procedure was used to select the best model for three dependent variables separately. Table 6 shows the best model for each dependent variable, and the best models are listed as follows.
Dependent Variable |
Best Model |
p-value |
R-squared |
RMSE |
AIC |
DMFTI-Permanent Teeth |
Age, Ethnicity |
<0.001 |
0.236 |
2.107 |
407.5298 |
DMFTI-Primary Teeth |
Age, Family Impact Scale |
<0.001 |
0.208 |
4.504 |
548.7978 |
Plaque index |
Family Impact Scale |
0.0014 |
0.107 |
0.585 |
168.0366 |
Table 6 Stepwise selection procedure summary
Random forest regression model (RFR)
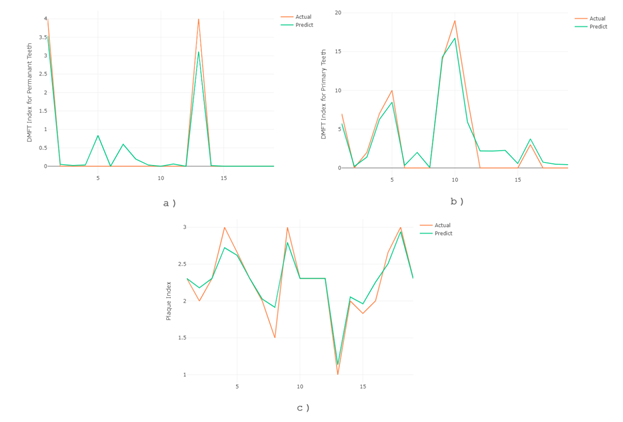
Figure 3 shows the comparison of actual vs predicted DMFTI values for permanent teeth, primary teeth, and Plaque index. For each graph, actual and predicted values lie approximately the same line.16

Figure 3 Comparison of actual and predicted a) DMFTI for permanent teeth, b) DMFTI for primary teeth, and c) Plaque index of RFR model
.
Support vector regression model (SVM)
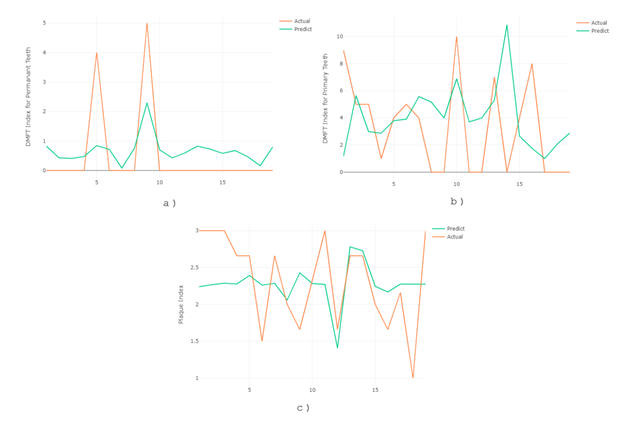
Figure 4 shows the comparison of actual vs predicted DMFTI values for permanent and primary teeth and Plaque index.

Figure 4 Comparison of actual and predicted a) DMFTI for permanent teeth, b) DMFTI for primary teeth, and c) Plaque index of SVR model
.
Table 7 illustrates the comparison of the three models for each dependent variable separately using MLR, SVR and RFR methods. The RFR model has the highest accuracy for DMFTI for primary teeth and Plaque index than the other two models, while the SVR model has the highest accuracy for DMFTI for permanent teeth.
Dependent Variable |
MLR |
SVR |
RFR |
R-square |
Accuracy |
R-square |
Accuracy |
R-Square |
Accuracy |
DMFTI for Permanent Teeth |
0.284 |
28.4% |
0. 9536 |
95.36% |
0.9264 |
92.64% |
DMFTI for Primary Teeth |
0.2632 |
26.32% |
0. 8564 |
85.64% |
0.9311 |
93.11% |
Plaque Index |
0.2118 |
21.18% |
0.8007 |
80.07 % |
0.9032 |
90.32% |
Table 7 Comparison of fitted model using MLR, SVR and RFR methods
Conclusion
In this research, the oral health status of 93 children with cerebral palsy was measured using DMFT index, Plaque Index and Care index and the relationship between those variables and the demographic data were observed. The best model for predicting oral health status was selected from the Multiple Linear Regression, Support Vector Regression and the Random Forest Regression models. A significant relationship was observed between the Plaque index and CP location. Also, CP-location had an enormous effect on the Plaque index. Children with hemiplegia have a higher risk of having lower oral health status, while children with diplegia had the lowest risk. The Random Forest Regression model was the best model for predicting children's oral health status with CP from the three models.
This research will help identify and compare children's oral health status with CP for different CP-location types. The updated database can be used to improve the accuracy of the predictions in the future of the higher number of patients.
Acknowledgments
The authors wish to acknowledge the Faculty of Dental Sciences of the University of Peradeniya for data collection and grant us access to use the data for statistical analysis.
Conflicts of interest
References
- Pervin R, Ahmed S, Hyder R, et al. Cerebral Palsy–an update. Northern International Medical College. 2015;5(1):293–296.
- Agrawal, A., & Indreshwar, V. Cerebral palsy in children: An overview. Journal of clinical orthopaedics and trauma. 2012;3(2):77–81.
- WHO. oral–health. 2018.
- Aukstakalnis R, Jurgelevicius T. The oral health status and behaviour of methadone users. Stomatologija, Baltic Dental and Maxillofacial Journal. 2018;20(1):27–31.
- Robertson, M. D., Schwendicke, F., de Araujo, et al. Dental caries experience, care index and restorative index in children with learning disabilities and children without learning disabilities; a systematic review and meta–analysis. BMC Oral Health. 2019;19(1):146.
- Farhadi F, Milab HF, Zarandi A. Determination of Decayed, Missing and Filled Teeth (DMFT) Index. pacificejournals. 2016;3(3).
- Akhter R, Hassan NM. Oral Health in Children with Cerebral Palsy. Intech Open. 2018.
- Rodriguez JP, Herrera JL, Gomez, et al. Dental decay and oral findings in children and adolescents affected by different types of cerebral palsy: A Comparative Study. The Journal of clinical pediatric dentistry .2018;42(1):62–66.
- Abanto, J., Carvalho, T. S. Parental reports of the oral health–related quality of life of children with cerebral palsy. BMC Oral Health. 2012;12(1):15.
- Daraniyagala T, Herath C, Gunasinghe M. Oral health status of children with cerebral palsy and its relationship with caregivers’ knowledge related to oral health. Journal of South Asian Association of Pediatric Dentistry. 2019;02.
- Lesaffre E, Declerck D. Statistical methods in oral health research. Statistical Modelling. 2014;14(6).
- Helland IS. Model reduction for prediction in regression models. Journal of Statistic. 2000;27(1):1–20.
- Awad M, Khanna R. Support vector regression. In: Awad M, Khanna R. Efficient Learning Machines. 2015;pp.67–80).
- Breiman L. Random forests. Machine Learning. 2001;45:5–32.
- Sullivan GM, Feinn R. Using effect size–or why the p value is not enough. J Grad Med Educ. 2012;4(3):279–282.
- Chakure A. Machine Learning..

©2021 Weerasekara, et al. This is an open access article distributed under the terms of the,
which
permits unrestricted use, distribution, and build upon your work non-commercially.


