eISSN: 2378-315X


Research Article Volume 4 Issue 5
1Neuropsychiatric Research Laboratory, Faculty of Medicine and Health, School of Health and Medical Sciences, Örebro University, Sweden
2Metabolic Engineering and Bioinformatics Group, Institute of Biology, Medicinal Chemistry and Biotechnology, National Hellenic Research Foundation, Greece
3Laboratory of Biotechnology, School of Chemical Engineering, National Technical University of Athens, Greece
4e-NIOS Applications PC, Greece
Correspondence: Aristotelis Chatziioannou, Metabolic Engineering and Bioinformatics Group, Institute of Biology, Medicinal Chemistry and Biotechnology, National Hellenic Research Foundation, 48 Vassileos Constantinou ave, 11635, Athens, Greece, Tel 30 210 7273751
Received: July 19, 2016 | Published: September 29, 2016
Citation: Chatziioannoub A, Pilalisb E, Venizelosa N, et al. Studying microarray gene expression data of schizophrenic patients for derivation of a diagnostic signature through the aid of machine learning. Biom Biostat Int J. 2016;4(5):182-199. DOI: 10.15406/bbij.2016.04.00106
Schizophrenia is a complex psychiatric disease that is affected by multiple genes, some of which could be used as biomarkers for specific diagnosis of the disease. In this work, we explore the power of machine learning methodologies for predicting schizophrenia, through the derivation of a biomarker gene signature for robust diagnostic classification purposes. Postmortem brain gene expression from the anterior prefrontal cortex of schizophrenia patients were used as training data for the construction of the classifiers. Several machine learning algorithms, such as support vector machines, random forests, and extremely randomized trees classifiers were developed and their performance was tested. After applying the feature selection method of support vector machines recursive feature elimination a 21-gene model was derived. Using these genes for developing classification models, the random forests algorithm outperformed all examined algorithms achieving an area under the curve of 0.98 and sensitivity of 0.89, discriminating schizophrenia from healthy control samples with high efficiency. The 21-gene model that was derived. from the feature selection is suggested for classifying schizophrenic patients, as it was successfully applied on an independent dataset of postmortem brain samples from the superior temporal cortex, and resulted in a classification model that achieved an area under the curve score of 0.91. Additionally, the functional analysis of the statisticallysignificant genes indicated many mechanisms related to the immune system.
Keywords: classification, schizophrenia, machine learning, gene expression, microarray studies, support vector machines, adaboost
AUC, area under the curve; CV, cross-validation; GO, gene ontology; extra trees, extremely randomized trees; kNN, k-nearest neighbor; RF, random forests; RMA, robust multi-array analysis; ROC, receiver operating characteristic; SVM, support vector machines; SVM-RFE, support vector machines recursive feature elimination; SZ, schizophrenia
Schizophrenia (SZ) is a serious psychiatric disease, with a complex genetic basis that affects around 1% of the population worldwide. The symptoms of the disease are divided into positive, negative and cognitive symptoms. Positive symptoms include hallucinations, delusions as well as disorganised speech and behaviour. Negative symptoms include anhedonia, social withdrawal, and lack of motivation and energy. Finally, cognitive symptoms involve cognitive dysfunctions of patients suffering from SZ. Pharmacological treatment of the disease mostly deals with the positive, psychotic symptoms of the disease, but does not improve cognitive and social dysfunction. Moreover, the etiology of SZ predicates upon a combination of genetic and environmental factors, probably in early life, that affect neurogenesis and neuronal plasticity.1 DNA microarray technologies enabling genome-wide gene expression profiling have been intensely exploited in the last decade, in order to promote the elucidation of the underlying biological mechanisms of SZ.2–5 These studies, through the high dimensional data that they yield, can prove to be very useful for the generation of diagnostic biomarker signatures in the management of SZ. The usefulness of these data is based on the fact that they may reveal several genes that act synergistically. Probably, the genes that present these synergistic effects with other genes cannot be associated with SZ on their own. The importance of the development of classification models in SZ is great as, at the moment, the diagnosis of the disease is based exclusively on the evaluation of the clinical symptoms after they have manifested. Despite much research effort, some of the most crucial questions regarding SZ have not been answered. The heterogeneity and the multi-factorial background of SZ suggest the study of this disease through statistical methods for the identification of patterns in the data. Differentially expressed genes occurring from microarray experiments can be utilized as classifying biomarkers gain and can reveal underlying genetic factors in relation to important psychiatric diseases, such as SZ.6
Classification includes two main methodological models: the supervised and the unsupervised model. In unsupervised learning, the instances are unlabeled and the aim is to discover useful classes.7 Supervised learning includes instances with known labels. In this study, supervised methods are used.6 In supervised learning, the classes are first defined and then the aim is to build a classifier that can separate samples among the defined classes citation.8 The discrimination of the classes in this study is based on the gene expression profiles of the samples.
Algorithms
Support vector machines (SVM)
In SVM, good separation of classes is achieved by the hyper-plane that has the largest distance to the nearest training data points of any class. The instances that are on the boundaries of the margin and determine the position and the orientation of the hyperplane are called the support vectors.9 SVM have some mathematical attributes that make them advantageous for gene expression classification, such as their ability to deal with large feature spaces and their ability to recognise outliers.10
Extremely randomized trees (Extra Trees)
The Extra Trees classifier belongs to the tree classifier algorithms and is extremely randomized. Its difference from other tree algorithms lies in the way it is built. At the point where the algorithm seeks the the most discriminative thresholds for the separation of the samples of a node into two groups, random thresholds are drawn for each of the randomly-selected features. Then, the best randomly-generated threshold is chosen as the splitting rule.11
Random forests (RF)
The RF classification algorithm is based on an ensemble of classification trees. Each classification tree is developed with bootstrap sampling of the data and for each split a random subset of the variables is used. RF uses two approaches: bagging or bootstrap aggregation that combines unstable learners and random variable selection for building the tree. No pruning is applied on the trees, in order to achieve low-bias trees. Additionally, bagging and random variable selection create trees with low correlation. As a classification method in microarray studies, it gives good performances even with noisy predictive variables and for this reason, it doesn’t need gene pre-selection. Finally, good performance is not so dependent on fine-tuning the parameters of the algorithm.12
Nearest neighbors
The k-nearest neighbors (kNN) algorithm is one of the most widely used and simplest methods among machine learning classification algorithms. In the training process, the kNN algorithm classifies an unlabeled instance based on the most common label of its k-neighbors in the training set. The distance metric that is used for the identification of the nearest neighbors affects the performance of the classifier.13–15
Adaboost
This classification algorithm boosts the performance of a simple classifier by combining a set of weak classifiers to a stronger learning algorithm. In this way, the weak classifiers have to perform only a little better than a random guessing, but the final combined classifier usually results in a good performance. In order to boost a weak classifier, it is forced to solve a series of learning problems. After every learning round, the examples are weighted and the importance of the ones that were falsely classified by the previous weak classifier is increased.16
Evaluation
In this specific study, cross-validation (CV) has been used as an evaluation method of the classifier. In n-fold CV, the training set is divided into n subsets. One after the other, one subset is used as a test subset for the trained classifier and the remaining n-1 subsets are used as the training subset.17 The performance of the different classification algorithms is evaluated through receiver operating characteristic (ROC) curves.18 In binary classification the outcomes can be labeled either as positive or negative. The true positive (also known as sensitivity or recall) rate refers to the proportion of positive samples that are correctly predicted as positive, whereas the false positive (also known as 1-specificity) rate refers to the proportion of negative examples that are incorrectly predicted as positive. The Y axis of the ROC curve represents the true positive rate and the X axis represents the false positive rate. The upper-left corner of the plot is the “ideal” point, as the true positive rate equals 1 and the false positive rate equals 0. After constructing a ROC curve for each classifier, the area under the curve (AUC), defined as the area between the ROC curve and the X axis, is used for the prediction performance of each classifier. In this study, the ROC curve for each classifier is estimated using a 10-fold CV procedure and we compare the mean AUC occurring from each curve. A larger AUC usually means a better classifier.19 Other metrics for evaluating the performance of a classifier are precision, sensitivity and accuracy. Precision is the ability of the classifier to not label a sample that is negative as positive. As mentioned before, sensitivity equals to the proportion of positive samples that are correctly predicted as positive and, finally, accuracy is the number of correct predictions made divided by the total number of predictions made.20
Feature selection
Feature selection can prove to be very important, as it can reveal subsets of informative genes that can discriminate schizophrenics from healthy control subjects. There are three main feature selection methods: filter, wrapper, and embedded methods. Filter methods filter out features that, based on statistical methods, are not informative. Filter feature selection is performed before applying classification (e.g. Fisher criterion score). Wrapper methods (e.g. stepwise forward selection and stepwise backward selection) search for optimal feature subsets, and utilize a classifier in order to evaluate the predictive power of the feature subsets. Compared to the filter methods, wrapper methods are usually more computationally demanding; but, they also provide more accurate results.21 The embedded methods select features while building a model. Embedded techniques are more computationally efficient than wrapper methods. An example of embedded methods is support vector recursive feature elimination (SVM-RFE), which is also used in this study. SVM-RFE is based on an iterative method of setting aside the feature with the lowest weight for each prediction method, until the optimal subset of genes is left.22
The aim of this study is to test if the microarray gene expression data from a postmortem brain dataset contain enough information for the classification of SZ. For this reason several classification algorithms have been tested and their performance has been evaluated.
Data preprocessing and analysis
A dataset that includes brain postmortem gene expression data of 28 schizophrenic and 23 healthy control subjects, derived from Broadmann area 10 (anterior prefrontal cortex), accessible at NCBI GEO database23 with the accession number GSE 17612, was analyzed using the Bioconductor package ‘affy’24 through the R programming system.25 Gene expression profiles were generated using the Affymetrix HG-U133 Plus 2.0 GeneChip. In this study, the robust multi-array analysis (RMA) method was used, which performs background correction on the Affymetrix perfect match data, applies quantile normalization and then performs summarization of the probe set information using median polish.26 The limma (moderated t-test) Bioconductor package of R has been used towards the identification of differentially expressed genes among the two classes.27 Transcripts were characterized as differentially expressed if their unadjusted p-value was less than 0.01. The differentially expressed genes were used as an input for the pathway analysis and gene prioritization as well as for the classification task.
Pathway analysis and gene prioritization
The differentially expressed genes were imported into the Bioinfominer web tool (available online: www.bioinfominer.com) for functional analysis based on established statistical tests and using different ontology databases, namely Gene Ontology (GO),28 Reactome,29 Human Phenotype Ontology30 and MGI Mammalian Phenotype Ontology.31 In this way, significant biological mechanisms associated to the input data were revealed. The next part of the analysis include the identification and the prioritization of master regulatory genes, which represent hub nodes in the GO tree structure. These genes play a central role, as they are related to many distinct, cross-talking GO terms.32
Classification algorithms and parameter optimization
In this study, the following classification techniques for the discrimination of the two classes (SZ and healthy controls) have been used: SVM, Extra Trees, RF, AdaBoost, and kNN classification algorithms. The classification algorithms come with a set of parameters. In this study, the parameters of the utilized classifiers were optimized with a CV grid search. Using this exhaustive search for each classifier, this method selects those parameters that maximize the mean AUC score of the CV.33 For all the classification models developed in this paper, parameter optimization has been performed. All of the machine learning methods were implemented in scikit-learn.34
Feature selection
The differentially expressed genes were used as the dataset for SVM-RFE method, in order to filter out the optimum informative feature set.35 Generally, SVM-RFE selects the minimum informative subset of features that separates classes, by progressively removing features that are not informative. This procedure has many rounds. At each round one gene is eliminated and an SVM classifier is trained based on the rest of the genes. That procedure is recursively repeated on the pruned sets until the number of features that present the best performance according to CV is reached.36 The reason for using SVM-RFE is that we aim at developing a sensitive and specific classification algorithm, based on realistic clinical biomarkers, assaying a small number of genes.37
Data collection and classification of the independent test cohort
The second dataset (NCBI GEO accession number: GSE 21935) was used as an independent group of samples in order to examine if the final genes occurring from the feature selection can be used as biomarkers in SZ. For this reason, the 21-gene model was used as an input for testing if those genes can discriminate SZ samples from healthy control samples on this independent dataset. The classification task was applied on the normalized gene expression values of the dataset, also resulting from RMA. The dataset included samples from the Brodmann Area 22 (superior temporal cortex) of 23 schizophrenic patients and 19 healthy controls.
Model evaluation
ROC curve was mainly used in this study as a metric to evaluate the output quality of each classification model, created from the 10-fold CV. Each of the 10 different splits of the dataset generated by the 10-fold CV results in a curve. Taking all of these curves, the mean AUC of each classifier is calculated. A classifier with larger mean AUC is considered to have better performance. Other metrics were also used as evaluation criteria for the performance of the classifiers, including accuracy, precision, and sensitivity.
Differentially expressed genes
Applying the criteria described above (see Data preprocessing and analysis in Materials and Methods), the microarray output showed that 164 genes were differentially expressed in schizophrenic patients compared to the healthy controls (Supplementary Table 1).
Pathway analysis and gene prioritization
The differentially expressed genes of (Supplementary Table 1) were submitted to the Bioinfominer web application for the elucidation of the overrepresented GO terms, Reactome pathways, Human Phenotype Ontology terms, and MGI Mammalian Phenotype Ontology terms. The full results are presented in (Supplementary Tables 2-5). The hub genes resulting from the gene prioritization corresponding to GO enrichment analysis are presented in (Supplementary Table 6).
RF |
Extra Trees |
kNN |
Adaboost |
SVM |
|||||
Parameter |
Optimal Value |
Parameter |
Optimal Value |
Parameter |
Optimal value |
Parameter |
Optimal value |
Parameter |
Optimal value |
Criterion |
gini |
Criterion: |
gini |
N_neighbors |
5 |
N_estimators |
500 |
kernel |
linear |
Max_features |
3.16 |
Max_features |
3.16 |
P |
1 |
Learning rate |
1 |
C |
1000 |
N_estimators |
10 |
N_estimators |
10 |
weights |
uniform |
||||
Table 1 Exhaustive grid search results for developed classification algorithms based on the 164 differentially expressed genes of the training dataset. Possible combinations of the parameter values are evaluated and the best combination is presented for each tested classification algorithm (RF, Extra Trees, kNN, AdaBoost, SVM)
RF parameters: Criterion: the function to measure the quality of a split; gini corresponds to the Gini impurity.
Max_features: the number of features to consider when looking for the best split.
N_estimators: the number of trees in the forest.
Extra Trees parameters: Criterion. Max_features N_estimators as described for RF.
kNN parameters: N_neighbors: number of neighbors to use.
P: power parameter for the Minkowski metric; p=1 is equivalent to using manhattan distance.
Weights: weight function used in prediction; in uniform weights all points in each neighborhood are weighted equally.
AdaBoost parameters: N_estimators: the maximum number of estimators at which boosting is terminated. Learning rate: Learning rate at which the contribution of each classifier shrinks.
SVM parameters: Kernel: specifies the kernel type to be used in the algorithm.
C: penalty parameter C of the error term.
Parameter optimization
A grid search was performed for the classifiers that used the expression values of the differentially expressed genes of the study. The parameters of each developed classification algorithm that were subjected to grid search through CV, as well as their final values that optimize their corresponding classifiers are presented in (Table 1). A grid search was also applied for the classifiers that were developed based on the genes that occurred from the feature selection (Supplementary Table 7) and for the classifiers developed for the testing dataset (Supplementary Table 8).
Classifier performance, feature selection
Classification algorithms, based on three datasets were developed. The first dataset contained the gene expression values of the differentially expressed genes from the training data (GSE 17612), the second dataset contained gene expression values of the 21 genes that occurred after the feature selection and the third dataset included the 21 genes also obtained from the SVM-RFE, with their corresponding gene expression values obtained from the independent test data (GSE 21935).
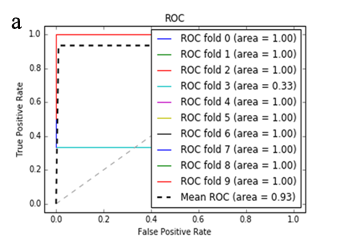
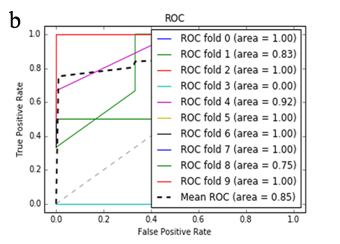
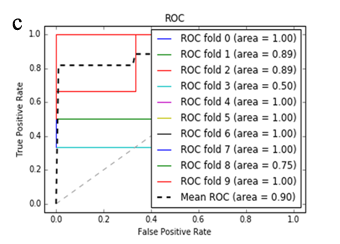
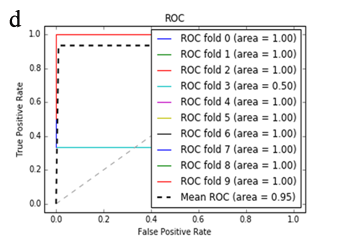
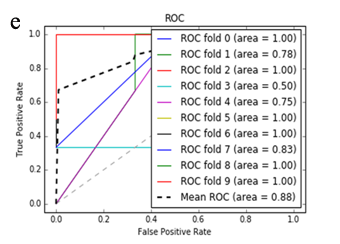
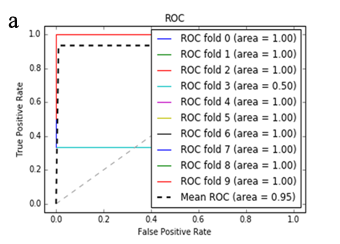
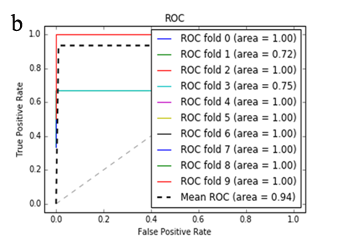
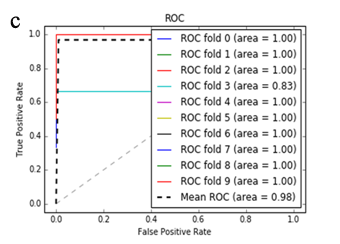
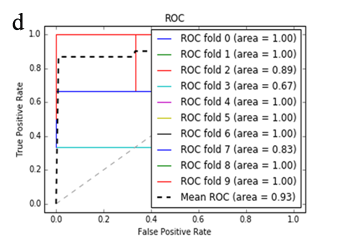
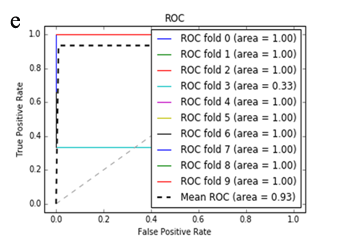
More specifically, in the context of the classification task: SZ vs healthy controls, classification algorithms that used the differentially expressed genes as input were compared. According to the mean AUC of the ROC curve, the SZ samples can be distinguished from healthy controls on the basis of gene expression. Figures 1 and 2 show the ROC curves response of 10-fold CV for the developed classifiers that used the differentially expressed genes and the genes resulting from the feature selection as an input, respectively. More specifically, (Figures 1a-1e) compare the classification techniques of SVM, Extra Trees classifiers, RF, kNN, and AdaBoost. The AdaBoost method, yielding a CV AUC of 0.95, generally outperforms the other tested classification techniques. Mean precision, accuracy, and sensitivity of each developed classifier are also presented in (Supplementary Table 9). In this study, the SVM-RFE with stratified CV was used in order to find the ranks and the optimal number of features for classifying SZ. Among the 164 differentially expressed genes, the maximal classification performance was achieved with 21 genes (Table 2). Then, each classifier incorporated genes that occurred from SVM-RFE. The 21-gene model for each classifier was validated using 10-fold CV. The final achieved mean AUC scores of all tested classification methods using the 21-gene model as input are presented in (Figures 2a-2e). The best performance was achieved by the RF classifier, which achieved a mean AUC of 0.98. The 21-gene model was also used for developing classifiers on an independent dataset, based on the gene expression values obtained from the analysis of this specific dataset. The performance metrics of these classifiers are also presented in (Supplementary Table 9). The RF classifier resulted in the best mean AUC score of 0.91.
Gene Symbol |
Gene Title |
p-value |
ARHGAP25 |
Rho GTPase activating protein 25 |
0.006071 |
GHR |
growth hormone receptor |
0.007136 |
CCL3 |
C-C motif chemokine ligand 3 |
0.006522 |
RPS6KA2 |
ribosomal protein S6 kinase A2 |
0.003058 |
CRYBG3 |
crystallin beta-gamma domain containing 3 |
0.002981 |
COX4I1 |
cytochrome c oxidase subunit 4I1 |
0.001857 |
KDM3A |
lysine demethylase 3A |
0.004227 |
LOC728613 |
programmed cell death 6 pseudogene |
0.002835 |
CCNA2 |
cyclin A2 |
0.006075 |
S100A8 |
S100 calcium binding protein A8 |
0.000122 |
COX19 |
COX19 cytochrome c oxidase assembly factor |
0.000137 |
MIR210HG |
MIR210 host gene |
0.002779 |
LOC100134317 |
hypothetical LOC100134317 |
0.009156 |
LONRF3 |
LON peptidase N-terminal domain and ring finger 3 |
0.006143 |
GSTM3 |
glutathione S-transferase mu 3 (brain) |
0.005909 |
VCPIP1 |
valosin containing protein (p97)/p47 complex interacting protein 1 |
0.006035 |
GJB2 |
gap junction protein beta 2 |
0.000687 |
LCOR |
ligand dependent nuclear receptor corepressor |
0.001645 |
MRS2 |
MRS2, magnesium transporter |
0.0075 |
NAA38 |
N(alpha)-acetyltransferase 38, NatC auxiliary subunit |
0.004166 |
ANKRD37 |
ankyrin repeat domain 37 |
0.006384 |
Table 2 Genes that occurred after the SVM-RFE feature selection and could discriminate the postmortem samples of SZ and healthy control subjects based on the differentially expressed genes of the GSE17612 dataset
The top ranked biological processes resulting from the Bioinfominer tool includes calcium mediated signaling (CCL3, ALMS1, LAT2) (Supplementary Table 2). The Ca2+ signaling pathway is a major component of the mechanisms that regulate neuronal excitability, information processing, and cognition. Differences in gene transcription related to calcium signaling can prove to be very important, as they may lead to alterations in the neuronal signaling. Abnormalities of the Ca2+ signaling pathway have been related to the development of SZ as well as of bipolar disorder.38 In addition there are findings that suggest that calcium is capable of inducing structural and cognitive deficits observed in SZ.39 The Reactome pathway analysis (Supplementary Table 3) resulted in FCGR activation (SYK, HCK, FCGR3A), classical antibody-mediated complement activation (C1QC, C1QB), complement cascade (CD59, C1QC, C1QB), and Fcgamma receptor dependent phagocytosis (SYK, HCK, DOCK1, FCGR3A), which are all clustered to innate immune system. The MGI Mammalian Phenotype Ontology analysis resulted in abnormal neutrophil morphology (S100A9, ITGA), abnormal neutrophil physiology (SYK, HCK, ITGAM, S100A9), and abnormal lymphatic vessel morphology (VEGFA, SYK, GJB2), which are all related to immune system phenotype (Supplementary Table 4). Finally, as shown in (Supplementary Table 5), the Human Phenotype Ontology analysis results in abnormalities related to the immune system, such as decreased serum complement C4b (C1QB and C1QC), Hashimoto thyroiditis (CIQB, CIQC) and increased antibody level in the blood (DSP, FAM13A and SAMHD1). These findings are in accordance to other schizophrenic studies. In a postmortem study of schizophrenic patients, the immune-related pathway has been reported to be involved in the pathology of SZ. In the same study, arachidonic acid cascade markers were found to have increased.40 A gene expression study on peripheral blood mononuclear cells identified differentially expressed genes related to the immune pathways in schizophrenic patients.41 Another SZ study of microarray data on Broadmann Area 22 reports a decrease of neuroinflammation related pathways, which may result to cognitive impairment and progression of SZ disease.42 Finally, the enrichment analysis of MGI Mammalian Phenotype Ontology terms (Supplementary Table 4) revealed another important term, namely abnormal central nervous system synaptic transmission (LZTS1, TRIB2, TNC, CSPG5). Many published SZ studies suggest there is an altered expression of presynaptic proteins. Anatomical and functional synaptic abnormalities probably contribute to the pathology and symptomatology of the disease, but synaptic disturbances are most likely to be a part of a complex network of events leading to the expression of the disease.43
The Reactome analysis also resulted in signaling by retinoic acid including the genes CYP26B1, ALDH1A3 CRABP1, and ALDH1A1 (Supplementary Table 3). Retinoid dysfunction may be also involved in the pathophysiology of SZ. CYP26B1 and ALDH1A3 as well as other genes involved in the synthesis and transportation of retinoic acid are implicated in SZ.40 The functional analysis also detected an integrin-mediated signaling pathway among the GO terms represented by the genes SYK, HCK, DOCK1, and ITGAM (Supplementary Table 2). The antipsychotic agent penfluridol has been reported to act through inhibition of the integrin signaling.44
Using supervised methods, we concluded that SZ can be classified by postmortem gene expression, even without applying any feature selection method, achieving an AUC score of 0.95 (Figure 1d) and sensitivity of 0.96 (Supplementary Table 9) with the use of the AdaBoost algorithm. Other classification algorithms also performed well, such as SVM with AUC 0.93 (Figure1a), accuracy 0.94, precision 0.97, and sensitivity 0.93 (Supplementary Table 9). SVM-RFE feature selection concluded to 21 genes and with their gene expression values a RF classifier was developed with 0.98 AUC score (Figure 2c). Additionally, the good performances of the classification models after applying the 21-gene model on the testing set supports the generalization of the 21-gene model to a test dataset, independent from the samples included in the model construction, with final AUC performance of 0.91 and 0.85 sensitivity, achieved by the RF classification model (Supplementary Table 9).
The 21 genes after the SVM-RFE feature selection (Table 2) reported in this study could be considered a candidate biomarker set for the diagnosis of SZ, to serve as a starting point for its further validation. As shown in (Supplementary Table 1), the genes rendering from the feature selection do not present high fold changes. There are other studies supporting that top-ranked genes may lose essential information specifically for classification purposes because of the fact that they are usually highly correlated.7,45 Therefore, we considered that it is reasonable for the feature selection algorithms to identify statistically significant genes with small fold changes as predictors for classification. Among the 21 genes, S100A8 and CCL3 genes have been previously associated to SZ.46,47 The S100A8 gene encodes a member of the S100 protein family. S100 proteins are involved in many cellular processes, such as cell cycle progression and differentiation. This specific protein acts as cytokine [provided by RefSeq]. The S100A8 gene also presents the greatest fold change among the upregulated genes of the study (Supplementary Table 1). The S100A8 gene dimerizes with the S100A9 gene, which was also shown to be differentially expressed in this study (Supplementary Table 1). This dimerization forms calprotectin, which is involved in innate immunity and inflammation. S100A8 is also reported to be upregulated at the protein level in another schizophrenic study.47 The CCL3 gene encodes a small inducible cytokine. Through binding to CCR1, CCR4 and CCR5 receptors, it participates in inflammatory responses [provided by RefSeq]. Chemokines are associated to neurobiological mechanisms, such as neurogenesis regulation or neurotransmitter-like effects, probably implicated in psychiatric disorders. It has been reported that many chemokines, including CXCL8 (IL-8), CCL2, CCL3 and CCL5, have been non-specifically associated to psychiatric diseases.48 All the aforementioned genes of the 21-gene model were also included in the hub genes list (Supplementary Table 6) resulted from the gene prioritization.
It is also worth mentioning that genes RPS6KA2 and CCNA2 are involved in the Reactome pathway of (R-HSA-2559582), which is also known as senescence messaging secretome. Oxidative stress can induce DNA damage, and the persistent DNA damage may be a senescence-associated secretory phenotype initiator.49 Generally, cellular senescence and apoptosis (programmed cell death) are ways to control DNA damage and exacerbation of those processes has been previously related SZ.50 Another hub gene included in the differentially expressed gene list is SYK (Supplementary Table 6), which is a member of the non-receptor type tyrosine protein kinases family. The encoded protein participates in coupling activated immunoreceptors to downstream signaling events that facilitate various cellular responses, such as proliferation, differentiation, and phagocytosis [provided by RefSeq]. It is considered to modulate epithelial cell growth. SYK was also identified to be upregulated in a study that examines the involvement of the immune system in the etiology of SZ.40 Finally, the differentially expressed hub gene VEGFA encodes a vascular endothelial growth factor A. This growth factor is involved in neurotrophy and neurogenesis, both possibly implicated in the pathophysiology of SZ. However, a study on the Hann Chinese population found no significant associations between different haplotypes of VEGFA and the risk of SZ.51
This study revealed 164 genes that were statistically significant. Furthermore, among the differentially expressed genes, CCL3, S100A8, SYK and VEGFA have been previously implicated in SZ and other psychiatric diseases. The main identified statistically significant ontological terms of interest that have been previously related to SZ are immune-related mechanisms. Other interesting mechanisms have also been found to be overrepresented, such as central nervous system synaptic transmission, integrin mediated signaling and retinoic acid signaling. In this study, the importance of the integrated feature selection and classification algorithm for the prediction of classes and for the identification of significant genes have been revealed once more.52 In summary, RF after the feature selection method of SVM-RFE outperformed the other tested classification methods with an AUC score of 0.98. The feature selection resulted to 21 genes that could discriminate schizophrenic and healthy control samples in two different independent datasets of postmortem brain samples obtained from two different brain regions.
None.
Author declares that there are no conflicts of interest.
| Gene Symbol | Gene Title | Fold Change (log2) | p-value |
| S100A8 | S100 calcium binding protein A8 | 1.826497 | 0.000122 |
| C1QB | complement component 1, q subcomponent, B chain | 0.731081 | 0.005022 |
| S100A9 | S100 calcium binding protein A9 | 0.662098 | 0.004514 |
| C1QC | complement component 1, q subcomponent, C chain | 0.643863 | 0.008943 |
| FCGR3A | Fc fragment of IgG receptor IIIa | 0.557102 | 0.005952 |
| BAG3 | BCL2 associated athanogene 3 | 0.537188 | 0.006337 |
| SLC16A3 | solute carrier family 16 member 3 | 0.482482 | 0.007186 |
| FCGR3B | Fc fragment of IgG receptor IIIb | 0.446586 | 0.005075 |
| ALOX5AP | arachidonate 5-lipoxygenase activating protein | 0.389708 | 0.005349 |
| RNASET2 | ribonuclease T2 | 0.370092 | 0.003478 |
| ANKRD37 | ankyrin repeat domain 37 | 0.352631 | 0.006384 |
| HK2 | hexokinase 2 | 0.348767 | 0.001683 |
| VEGFA | vascular endothelial growth factor A | 0.33662 | 0.005811 |
| HCK | HCK proto-oncogene, Src family tyrosine kinase | 0.335132 | 0.00693 |
| DOCK8 | dedicator of cytokinesis 8 | 0.333469 | 0.00656 |
| APBB1IP | amyloid beta precursor protein binding family B member 1 interacting protein | 0.320001 | 0.008019 |
| DIS3L2 | DIS3 like 3'-5' exoribonuclease 2 | 0.281186 | 0.009462 |
| CD59 | CD59 molecule | 0.279477 | 0.009546 |
| SAMHD1 | SAM domain and HD domain 1 | 0.273887 | 0.004751 |
| ACVRL1 | activin A receptor like type 1 | 0.269788 | 0.003338 |
| LAT2 | linker for activation of T-cells family member 2 | 0.242039 | 0.002806 |
| ITGAM | integrin subunit alpha M | 0.240918 | 0.005904 |
| SYK | spleen tyrosine kinase | 0.240093 | 0.00638 |
| P4HA1 | prolyl 4-hydroxylase subunit alpha 1 | 0.237544 | 0.00403 |
| MIR100HG | mir-100-let-7a-2 cluster host gene | 0.230178 | 0.006184 |
| MIR210HG | MIR210 host gene | 0.215512 | 0.002779 |
| KDM3A | lysine demethylase 3A | 0.213788 | 0.004227 |
| GSTM3 | glutathione S-transferase mu 3 (brain) | 0.212229 | 0.005909 |
| LONRF3 | LON peptidase N-terminal domain and ring finger 3 | 0.208657 | 0.006143 |
| CRYBG3 | crystallin beta-gamma domain containing 3 | 0.20283 | 0.002981 |
| LCOR | ligand dependent nuclear receptor corepressor | 0.19837 | 0.001645 |
| AKAP12 | A-kinase anchoring protein 12 | 0.196526 | 0.001368 |
| ARID5B | AT-rich interaction domain 5B | 0.194599 | 0.00905 |
| CCDC69 | coiled-coil domain containing 69 | 0.192349 | 0.001352 |
| SMAD7 | SMAD family member 7 | 0.189792 | 0.003705 |
| IGF1R | insulin like growth factor 1 receptor | 0.186403 | 0.009458 |
| APOC2 | apolipoprotein C-II | 0.183114 | 0.002289 |
| NAA38 | N(alpha)-acetyltransferase 38, NatC auxiliary subunit | 0.182993 | 0.004166 |
| PAPD5 | PAP associated domain containing 5 | 0.182046 | 0.008159 |
| JAKMIP2 | janus kinase and microtubule interacting protein 2 | 0.178467 | 0.005588 |
| MRS2 | MRS2, magnesium transporter | 0.177144 | 0.0075 |
| GHR | growth hormone receptor | 0.17617 | 0.007136 |
| C2CD2 | C2 calcium-dependent domain containing 2 | 0.170099 | 0.00975 |
| COX19 | COX19 cytochrome c oxidase | 0.16423 | 0.000137 |
| assembly factor | |||
| SNRNP48 | small nuclear ribonucleoprotein U11/U12 subunit 48 | 0.163574 | 0.009062 |
| MOB1A | MOB kinase activator 1A | 0.163389 | 0.007832 |
| ARHGAP25 | Rho GTPase activating protein 25 | 0.161316 | 0.006071 |
| COX4I1 | cytochrome c oxidase subunit 4I1 | 0.155805 | 0.001857 |
| ABCD4 | ATP binding cassette subfamily D member 4 | 0.15033 | 0.006105 |
| ST3GAL1 | ST3 beta-galactoside alpha-2,3-sialyltransferase 1 | 0.147061 | 0.009269 |
| RPS6KA2 | ribosomal protein S6 kinase A2 | 0.146662 | 0.003058 |
| SOAT1 | sterol O-acyltransferase 1 | 0.140692 | 0.006413 |
| ZC3H18 | zinc finger CCCH-type containing 18 | 0.138364 | 0.002404 |
| MAX | MYC associated factor X | 0.13176 | 0.008971 |
| RGS19 | regulator of G-protein signaling 19 | 0.131705 | 0.005579 |
| DKK1 | dickkopf WNT signaling pathway inhibitor 1 | 0.131382 | 0.006626 |
| GTF2A2 | general transcription factor IIA 2 | 0.125946 | 0.008314 |
| HSBP1L1 | heat shock factor binding protein 1-like 1 | 0.12215 | 0.005242 |
| C1GALT1C1 | C1GALT1 specific chaperone 1 | 0.121886 | 0.007076 |
| CASP6 | caspase 6 | 0.121064 | 0.00282 |
| SLC4A2 | solute carrier family 4 member 2 | 0.118597 | 0.006411 |
| VCPIP1 | valosin containing protein (p97)/p47 complex interacting protein 1 | 0.114991 | 0.006035 |
| CCNA2 | cyclin A2 | 0.106498 | 0.006075 |
| FBXO42 | F-box protein 42 | 0.102273 | 0.007903 |
| LOC284009 | hypothetical LOC284009 | 0.099299 | 0.0068 |
| ZNF202 | zinc finger protein 202 | 0.099196 | 0.005258 |
| KHDC1 | KH homology domain containing 1 | 0.093737 | 0.008083 |
| RPS6KB1 | ribosomal protein S6 kinase B1 | 0.091089 | 0.007656 |
| TMEM184C | transmembrane protein 184C | 0.090477 | 0.003114 |
| FHAD1 | forkhead-associated (FHA) phosphopeptide binding domain 1 | -0.08689 | 0.005764 |
| PRKRIP1 | PRKR interacting protein 1 (IL11 inducible) | -0.08776 | 0.002776 |
| DOCK1 | dedicator of cytokinesis 1 | -0.09194 | 0.00703 |
| FAM13A | family with sequence similarity 13 member A | -0.09411 | 0.006757 |
| CHMP6 | charged multivesicular body protein 6 | -0.0953 | 0.009337 |
| ZNF777 | zinc finger protein 777 | -0.09585 | 0.007735 |
| FAM204A | family with sequence similarity 204 member A | -0.09614 | 0.009096 |
| LOC440867 | uncharacterized LOC440867 | -0.10242 | 0.003157 |
| ANAPC13 | anaphase promoting complex subunit 13 | -0.10469 | 0.009113 |
| CORIN | corin, serine peptidase | -0.10562 | 0.003811 |
| TMEM239 | transmembrane protein 239 | -0.10666 | 0.008018 |
| VIPR2 | vasoactive intestinal peptide receptor 2 | -0.10844 | 0.004582 |
| TEX264 | testis expressed 264 | -0.10958 | 0.001421 |
| ZNF18 | zinc finger protein 18 | -0.1108 | 0.003814 |
| HSD17B8 | hydroxysteroid (17-beta) dehydrogenase 8 | -0.11094 | 0.008904 |
| JMJD4 | jumonji domain containing 4 | -0.113 | 0.005253 |
| BROX | BRO1 domain and CAAX motif containing | -0.11408 | 0.003452 |
| CCS | copper chaperone for superoxide dismutase | -0.11545 | 0.000723 |
| ATP1A4 | ATPase Na+/K+ transporting subunit alpha 4 | -0.11584 | 0.006439 |
| EXOSC9 | exosome component 9 | -0.11602 | 0.001765 |
| LOC100506459 | uncharacterized LOC100506459 | -0.11984 | 0.003974 |
| TSEN15 | tRNA splicing endonuclease subunit 15 | -0.12003 | 0.007396 |
| DMKN | dermokine | -0.12071 | 0.004637 |
| C3orf35 | chromosome 3 open reading frame 35 | -0.12101 | 0.001778 |
| WDR86 | WD repeat domain 86 | -0.12271 | 0.008758 |
| SMURF1 | SMAD specific E3 ubiquitin protein ligase 1 | -0.12448 | 0.00463 |
| FAM173A | family with sequence similarity 173 member A | -0.12475 | 0.008634 |
| LOC730098 | hypothetical LOC730098 | -0.12539 | 0.002728 |
| IFT27 | intraflagellar transport 27 | -0.12605 | 0.004584 |
| SAPCD1 | suppressor APC domain containing 1 | -0.12885 | 0.004477 |
| LINC00900 | long intergenic non-protein coding RNA 900 | -0.13079 | 0.007456 |
| LRRN4CL | LRRN4 C-terminal like | -0.13079 | 0.002182 |
| JAG1 | jagged 1 | -0.13119 | 0.003896 |
| C17orf97 | chromosome 17 open reading frame 97 | -0.13121 | 0.006676 |
| PNLDC1 | PARN like, ribonuclease domain containing 1 | -0.13189 | 0.001077 |
| CHCHD5 | coiled-coil-helix-coiled-coil-helix domain containing 5 | -0.1319 | 0.009292 |
| PEX10 | peroxisomal biogenesis factor 10 | -0.13306 | 0.00123 |
| PRR5L | proline rich 5 like | -0.13592 | 0.004642 |
| PARGP1 | poly(ADP-ribose) glycohydrolase pseudogene 1 | -0.13691 | 0.008385 |
| ZFP2 | ZFP2 zinc finger protein | -0.13968 | 0.00489 |
| ADGRA1 | adhesion G protein-coupled receptor A1 | -0.14208 | 0.006006 |
| IGLV1-44 | immunoglobulin lambda variable 1-44 | -0.14244 | 0.009018 |
| MSANTD1 | Myb/SANT DNA binding domain containing 1 | -0.14359 | 0.009775 |
| WSB1 | WD repeat and SOCS box containing 1 | -0.14615 | 0.000747 |
| LZTS1 | leucine zipper, putative tumor suppressor 1 | -0.14794 | 0.007089 |
| ALMS1 | ALMS1, centrosome and basal body associated protein | -0.14839 | 0.00191 |
| SOHLH2 | spermatogenesis and oogenesis specific basic helix-loop-helix 2 | -0.14951 | 0.002074 |
| ACOX3 | acyl-CoA oxidase 3, pristanoyl | -0.14973 | 0.006074 |
| ICA1 | islet cell autoantigen 1 | -0.15208 | 0.000761 |
| AMFR | autocrine motility factor receptor | -0.15799 | 0.005319 |
| ALDH1A3 | aldehyde dehydrogenase 1 | -0.15804 | 0.003569 |
| family member A3 | |||
| PCDHA1 | protocadherin alpha 1 | -0.16169 | 0.008645 |
| COL12A1 | collagen type XII alpha 1 | -0.1625 | 0.006727 |
| FMOD | fibromodulin | -0.16822 | 0.00679 |
| LOC440896 | hypothetical LOC440896 | -0.16924 | 0.006958 |
| PXDN | peroxidasin | -0.17006 | 0.002642 |
| ADAMTS8 | ADAM metallopeptidase with thrombospondin type 1 motif 8 | -0.1713 | 0.003075 |
| LYRM4 | LYR motif containing 4 | -0.18083 | 0.000795 |
| CSPG5 | chondroitin sulfate proteoglycan 5 | -0.1824 | 0.008227 |
| MTG2 | mitochondrial ribosome-associated GTPase 2 | -0.18278 | 0.008865 |
| SPAG6 | sperm associated antigen 6 | -0.18278 | 0.003408 |
| IGFBP6 | insulin like growth factor binding protein 6 | -0.1859 | 0.004757 |
| PDCD6 | programmed cell death 6 | -0.1912 | 0.000818 |
| SLC22A8 | solute carrier family 22 member 8 | -0.19273 | 0.007573 |
| LOC100134317 | hypothetical LOC100134317 | -0.19749 | 0.009156 |
| SETD9 | SET domain containing 9 | -0.20602 | 0.008609 |
| FLRT1 | fibronectin leucine rich transmembrane protein 1 | -0.20607 | 0.001075 |
| GPCPD1 | Glycerophosphocholine | -0.2067 | 0.006461 |
| phosphodiesterase 1 | |||
| SLC6A20 | solute carrier family 6 member 20 | -0.20902 | 0.002204 |
| PEX7 | peroxisomal biogenesis factor 7 | -0.21003 | 0.001087 |
| TRIB2 | tribbles pseudokinase 2 | -0.21164 | 0.001142 |
| RASGRP1 | RAS guanyl releasing protein 1 | -0.21276 | 0.005429 |
| TNC | tenascin C | -0.21351 | 0.002824 |
| AHSA2 | AHA1, activator of heat shock 90kDa protein ATPase homolog 2 (yeast) | -0.22234 | 0.007083 |
| ADTRP | androgen dependent TFPI regulating protein | -0.23107 | 0.008219 |
| AGA | aspartylglucosaminidase | -0.24003 | 0.006235 |
| MPPED2 | metallophosphoesterase domain containing 2 | -0.24746 | 0.001065 |
| CA4 | carbonic anhydrase 4 | -0.24836 | 0.003805 |
| ARMCX4 | armadillo repeat containing, X-linked 4 | -0.25182 | 0.000947 |
| SPON2 | spondin 2 | -0.25468 | 0.003923 |
| C1orf95 | chromosome 1 open reading frame 95 | -0.27384 | 0.009582 |
| ECM2 | extracellular matrix protein 2 | -0.28447 | 0.006839 |
| TYRP1 | tyrosinase-related protein 1 | -0.29618 | 0.003082 |
| PHLDB2 | pleckstrin homology like domain family B member 2 | -0.32016 | 0.009663 |
| ALDH1A1 | aldehyde dehydrogenase 1 family member A1 | -0.32543 | 0.007148 |
| CYP26B1 | cytochrome P450 family 26 subfamily B member 1 | -0.32578 | 0.000915 |
| CRABP1 | cellular retinoic acid binding protein 1 | -0.37849 | 0.003868 |
| SLC13A4 | solute carrier family 13 member 4 | -0.38768 | 0.001843 |
| CCL3 | C-C motif chemokine ligand 3 | -0.4024 | 0.006522 |
| FRZB | frizzled-related protein | -0.51562 | 0.001186 |
| FRMPD2 | FERM and PDZ domain containing 2 | -0.52363 | 0.001204 |
| GJB2 | gap junction protein beta 2 | -0.53054 | 0.000687 |
| LOC728613 | programmed cell death 6 pseudogene | -0.66246 | 0.002835 |
| DSP | desmoplakin | -0.70051 | 0.009817 |
| OGN | osteoglycin | -0.80467 | 0.002176 |
Supplementary Table 1 The list of 164 differentially expressed genes identified after comparing the gene expression of healthy control and SZ samples and applying a p-value cut-off ≤ 0.01
Rank |
Term id |
Term Definition |
Enrichment |
Hypergeometric p-value |
Corrected p-value |
1 |
GO:0046324 |
regulation of glucose import |
2/7 |
2.27E-03 |
2.90E-03 |
2 |
GO:0001816 |
cytokine production |
3/26 |
2.57E-03 |
7.00E-03 |
3 |
GO:0009060 |
aerobic respiration |
3/28 |
3.18E-03 |
8.80E-03 |
4 |
GO:0042339 |
keratan sulfate metabolic process |
3/32 |
4.67E-03 |
0.0117 |
5 |
GO:0016558 |
protein import into peroxisome matrix |
2/10 |
4.76E-03 |
0.0174 |
6 |
GO:0030593 |
neutrophil chemotaxis |
4/65 |
5.08E-03 |
0.0196 |
7 |
GO:0030199 |
collagen fibril organization |
3/38 |
7.58E-03 |
0.0217 |
8 |
GO:0038083 |
peptidyl-tyrosine autophosphorylation |
3/39 |
8.15E-03 |
0.0244 |
9 |
GO:0030514 |
negative regulation of BMP signaling pathway |
3/42 |
1.00E-02 |
0.0271 |
10 |
GO:0038096 |
Fc-gamma receptor signaling pathway involved in phagocytosis |
4/82 |
0.0119 |
0.0291 |
11 |
GO:0007229 |
integrin-mediated signaling pathway |
4/84 |
0.0124 |
0.0341 |
12 |
GO:0071407 |
cellular response to organic cyclic compound |
4/86 |
0.0134 |
0.0373 |
13 |
GO:0019722 |
calcium-mediated signaling |
3/51 |
0.0169 |
0.0423 |
14 |
GO:0032760 |
positive regulation of tumor necrosis factor production |
3/48 |
0.0144 |
0.0438 |
15 |
GO:0019370 |
leukotriene biosynthetic process |
2/21 |
0.0206 |
0.0477 |
16 |
GO:0051090 |
regulation of sequence-specific DNA binding transcription factor activity |
2/22 |
0.0225 |
0.0498 |
Supplementary Table 2 Overrepresented GO terms occurring from the enrichment analysis of the differentially expressed genes (category Biological Process). The ranking of statisticallysignificant terms is according to the corrected p-value
Rank |
Term id |
Term Definition |
Enrichment |
Hypergeometric p-value |
Corrected p-value |
1 |
R-HSA-5365859 |
RA biosynthesis pathway |
4/22 |
3.22E-05 |
3.10E-03 |
2 |
R-HSA-5362517 |
Signaling by Retinoic Acid |
4/42 |
4.31E-04 |
9.00E-03 |
3 |
R-HSA-2029481 |
FCGR activation |
3/19 |
5.19E-04 |
0.0123 |
4 |
R-HSA-354192 |
Integrin alphaIIb beta3 signaling |
3/25 |
1.19E-03 |
0.0171 |
5 |
R-HSA-2022854 |
Keratan sulfate biosynthesis |
3/27 |
1.49E-03 |
0.0186 |
6 |
R-HSA-1638074 |
Keratan sulfate/keratin metabolism |
3/33 |
2.68E-03 |
0.0259 |
7 |
R-HSA-76009 |
Platelet Aggregation (Plug Formation) |
3/34 |
2.92E-03 |
0.0283 |
8 |
R-HSA-3560782 |
Diseases associated with glycosaminoglycan metabolism |
3/38 |
4.01E-03 |
0.0336 |
9 |
R-HSA-2022857 |
Keratan sulfate degradation |
2/12 |
4.41E-03 |
0.0362 |
10 |
R-HSA-173623 |
Classical antibody-mediated complement activation |
2/15 |
6.90E-03 |
0.0431 |
11 |
R-HSA-166658 |
Complement cascade |
3/47 |
7.30E-03 |
0.0469 |
12 |
R-HSA-2029480 |
Fcgamma receptor (FCGR) dependent phagocytosis |
4/91 |
7.45E-03 |
0.048 |
Supplementary Table 3 Overrepresented Reactome pathways occurring from the enrichment analysis of the differentially expressed genes. The ranking of statistically significant terms is according to the corrected p-value
Rank |
Term id |
Term Definition |
Enrichment |
Hypergeometric p-value |
Corrected p-value |
1 |
MP:0010458 |
pulmonary trunk hypoplasia |
2/3 |
4.07E-04 |
2.90E-03 |
2 |
MP:0000380 |
small hair follicles |
2/5 |
1.34E-03 |
6.30E-03 |
3 |
MP:0011090 |
perinatal lethality, incomplete penetrance |
9/226 |
1.52E-03 |
7.60E-03 |
4 |
MP:0010505 |
abnormal T wave |
2/6 |
1.99E-03 |
0.0115 |
5 |
MP:0001879 |
abnormal lymphatic vessel morphology |
3/24 |
2.69E-03 |
0.0152 |
6 |
MP:0001614 |
abnormal blood vessel morphology |
6/142 |
6.77E-03 |
0.0176 |
7 |
MP:0001177 |
atelectasis |
4/67 |
7.98E-03 |
0.019 |
8 |
MP:0000008 |
increased white adipose tissue amount |
3/38 |
9.94E-03 |
0.0216 |
9 |
MP:0001261 |
obese |
4/73 |
0.0107 |
0.0268 |
10 |
MP:0002828 |
abnormal renal glomerular capsule morphology |
2/14 |
0.0113 |
0.0284 |
11 |
MP:0010239 |
decreased skeletal muscle weight |
2/15 |
0.013 |
0.034 |
12 |
MP:0004938 |
dilated vasculature |
2/17 |
0.0166 |
0.0365 |
13 |
MP:0002106 |
abnormal muscle physiology |
4/84 |
0.0172 |
0.0365 |
14 |
MP:0002206 |
abnormal CNS synaptic transmission |
4/87 |
0.0193 |
0.0373 |
15 |
MP:0005065 |
abnormal neutrophil morphology |
2/18 |
0.0185 |
0.0397 |
16 |
MP:0009050 |
dilated proximal convoluted tubules |
2/19 |
0.0205 |
0.0462 |
17 |
MP:0002463 |
abnormal neutrophil physiology |
4/94 |
0.0249 |
0.0473 |
Supplementary Table 4 Overrepresented MGI Mammalian Phenotype Ontology terms occurring from the enrichment analysis of the differentially expressed genes. The ranking of statistically significant terms is according to the corrected p-value
Rank |
Term id |
Term Definition |
Enrichment |
Hypergeometric p-value |
Corrected p-value |
1 |
HP:0200120 |
Chronic active hepatitis |
3/11 |
2.00E-04 |
2.50E-03 |
2 |
HP:0001394 |
Cirrhosis |
6/104 |
1.02E-03 |
3.90E-03 |
3 |
HP:0002138 |
Subarachnoid hemorrhage |
2/5 |
1.16E-03 |
6.80E-03 |
4 |
HP:0045044 |
Decreased serum complement C4b |
2/9 |
4.06E-03 |
8.40E-03 |
5 |
HP:0000872 |
Hashimoto thyroiditis |
2/11 |
6.12E-03 |
0.0104 |
6 |
HP:0010702 |
Increased antibody level in blood |
3/35 |
6.53E-03 |
0.0157 |
7 |
HP:0000992 |
Cutaneous photosensitivity |
4/73 |
8.45E-03 |
0.0158 |
8 |
HP:0002910 |
Elevated hepatic transaminases |
6/155 |
7.37E-03 |
0.0162 |
9 |
HP:0002092 |
Pulmonary hypertension |
5/114 |
8.46E-03 |
0.0217 |
10 |
HP:0000979 |
Purpura |
3/47 |
0.0147 |
0.0272 |
11 |
HP:0100729 |
Large face |
2/20 |
0.0198 |
0.0277 |
12 |
HP:0002206 |
Pulmonary fibrosis |
3/48 |
0.0155 |
0.0288 |
13 |
HP:0001635 |
Congestive heart failure |
6/197 |
0.0217 |
0.0303 |
14 |
HP:0001808 |
Fragile nails |
2/22 |
0.0238 |
0.0305 |
15 |
HP:0000311 |
Round face |
4/98 |
0.0227 |
0.032 |
16 |
HP:0010982 |
Polygenic inheritance |
2/23 |
0.0258 |
0.0353 |
17 |
HP:0011344 |
Severe global developmental delay |
4/103 |
0.0266 |
0.0403 |
18 |
HP:0002633 |
Vasculitis |
3/59 |
0.0268 |
0.0434 |
19 |
HP:0001369 |
Arthritis |
4/104 |
0.0275 |
0.0447 |
20 |
HP:0006519 |
Alveolar cell carcinoma |
2/25 |
0.0302 |
0.0467 |
21 |
HP:0002922 |
Increased CSF protein |
2/26 |
0.0325 |
0.0476 |
22 |
HP:0009891 |
Underdeveloped supraorbital ridges |
2/62 |
0.0304 |
0.049 |
Supplementary Table 5 Overrepresented Human Phenotype Ontology terms occurring from the enrichment analysis of the differentially expressed genes. The ranking of statistically significant terms is according to the corrected p-value
Rank |
Gene Symbol |
Clusters |
Enriched Clusters |
Interactors |
Associated Drugs |
1 |
CCL3 |
4 |
4 |
0 |
1 |
2 |
SYK |
4 |
4 |
2 |
10 |
3 |
RASGRP1 |
2 |
2 |
0 |
0 |
4 |
VEGFA |
2 |
2 |
0 |
24 |
5 |
SMAD7 |
2 |
2 |
1 |
0 |
6 |
RPS6KB1 |
2 |
2 |
2 |
2 |
7 |
S100A9 |
2 |
2 |
2 |
0 |
8 |
S100A8 |
2 |
2 |
3 |
0 |
9 |
FMOD |
2 |
1 |
0 |
0 |
10 |
HCK |
2 |
2 |
0 |
5 |
Supplementary Table 6 Hub genes ranking according to ontological clusters amount. Hub genes according to ontological clusters amount. Bioinfominer reveals 10 genes as hub nodes of the enriched GO graph
RF |
Extra Trees |
kNN |
Adaboost |
SVM |
|||||
Parameter |
Optimal Value |
Parameter |
Optimal Value |
Parameter |
Optimal Value |
Parameter |
Optimal Value |
Parameter |
Optimal Value |
Criterion |
gini |
Criterion: |
gini |
N_neighbors |
5 |
N_estimators |
100 |
kernel |
linear |
Max_features |
7.07 |
Max_features |
5.5 |
p |
1 |
Learning rate |
1 |
C |
200 |
N_estimators |
50 |
N_estimators |
30 |
weights |
uniform |
||||
Supplementary Table 7 Exhaustive grid search results for the developed classification algorithms (RF, Extra Trees, kNN, Adaboost, SVM) based on genes that occurred from SVM-RFE feature selection. Possible combinations of parameter values are evaluated and the optimal value for each tested classification algorithm is presented
RF parameters: Criterion: the function to measure the quality of a split; gini corresponds to the Gini impurity.
Max_features: the number of features to consider when looking for the best split;
N_estimators: the number of trees in the forest.
Extra Trees parameters: Criterion. Max_features. N_estimators as described in RF.
kNN parameters: N_neighbors: number of neighbors to use by default for k_neighbors queries.
P: power parameter for the Minkowski metric; p=1 is equivalent to using manhattan_distance.
Weights: weight function used in prediction; in uniform weights all points in each neighborhood are weighted equally.
AdaBoost parameters: N_estimators: the maximum number of estimators at which boosting is terminated. Learning rate: Learning rate at which the contribution of each classifier shrinks.
SVM parameters: Kernel: specifies the kernel type to be used in the algorithm.
C: penalty parameter C of the error term.
RF |
Extra Trees |
kNN |
Adaboost |
SVM |
|||||
Parameter |
Optimal Value |
Parameter |
Optimal Value |
Parameter |
Optimal Value |
Parameter |
Optimal Value |
Parameter |
Optimal Value |
Criterion |
gini |
Criterion: |
gini |
N_neighbors |
5 |
N_estimators |
200 |
kernel |
linear |
Max_features |
3.87 |
Max_features |
10 |
p |
1 |
Learning rate |
1 |
C |
1000 |
N_estimators |
15 |
N_estimators |
10 |
weights |
uniform |
||||
Supplementary Table 8 Exhaustive grid search results for the construction of the classification models of gene expression from the independent test dataset GSE 21935, based on the 21 gene subset of the differentially expressed genes, after SVM-RFE feature selection on the GSE 17162 dataset. All the possible combinations of parameter values are evaluated and the best combination is presented for each tested classification algorithm.
RF parameters: Criterion: the function to measure the quality of a split; gini corresponds to the Gini impurity.
Max_features: the number of features to consider when looking for the best split.
N_estimators: the number of trees in the forest.
Extra Trees parameters: Criterion, Max_features, N_estimators.
kNN parameters: N_neighbors: number of neighbors to use by default for k_neighbors queries.
P: power parameter for the Minkowski metric; p=1 is equivalent to using manhattan distance.
Weights: weight function used in prediction; in uniform weights all points in each neighborhood are weighted equally.
Adaboost parameters: N_estimators: the maximum number of estimators at which boosting is terminated. Learning rate: Learning rate at which the contribution of each classifier shrinks.
SVM parameters: Kernel: specifies the kernel type to be used in the algorithm.
C: penalty parameter C of the error term.
GSE 17612 (no feature selection) |
ROC_AUC |
Accuracy |
Precision |
Sensitivity |
kNN |
0.88 |
0.85 |
0.84 |
0.93 |
SVM |
0.93 |
0.94 |
0.97 |
0.93 |
RF |
0.9 |
0.77 |
0.84 |
0.81 |
Extra Trees |
0.85 |
0.78 |
0.89 |
0.75 |
AdaBoost |
0.95 |
0.92 |
0.91 |
0.96 |
GSE 17612 (with feature selection) |
ROC_AUC |
Accuracy |
Precision |
Sensitivity |
kNN |
0.93 |
0.9 |
0.9 |
0.93 |
SVM |
0.95 |
0.94 |
0.97 |
0.93 |
RF |
0.98 |
0.83 |
0.93 |
0.89 |
Extra Trees |
0.94 |
0.88 |
0.87 |
0.84 |
AdaBoost |
0.93 |
0.78 |
0.8 |
0.77 |
GSE 21935 |
ROC_AUC |
Accuracy |
Precision |
Sensitivity |
kNN |
0.72 |
0.63 |
0.79 |
0.58 |
SVM |
0.82 |
0.76 |
0.87 |
0.74 |
RF |
0.91 |
0.76 |
0.83 |
0.85 |
Extra Trees |
0.76 |
0.6 |
0.76 |
0.65 |
Adaboost |
0.9 |
0.81 |
0.75 |
0.86 |
Supplementary Table 9 Mean performance estimation values of different classification algorithms after applying 10-fold CV. Italics indicate the highest value corresponding to each performance metric

©2016 Chatziioannoub, et al. This is an open access article distributed under the terms of the, which permits unrestricted use, distribution, and build upon your work non-commercially.
2 7