Research Article Volume 10 Issue 3
Adya distribution with properties and application
Rama Shanker,1  Kamlesh Kumar Shukla,2 Amaresh Ranjan,3 Ravi Shanker4
1 Department of Statistics, Assam University, Silchar, Assam, India
2 Department of Community Medicine, Noida International Institute of Medical Science, India
3 Department of Mathematics, Nalanda Open University, India
4 Department of Mathematics, G.L.A. College, N.P University, India
Correspondence: Rama Shanker, Department of Statistics, Assam University, Silchar, Assam, India
Received: June 18, 2021 | Published: August 11, 2021
Citation: Shanker R, Shukla KK, Ranjan A, et al. Adya distribution with properties and application. Biom Biostat Int J. 2021;10(3):81-88. DOI: 10.15406/bbij.2021.10.00334
Download PDF
Abstract
In the present paper, a new one parameter lifetime distribution named, “Adya distribution’ has been proposed for modeling lifetime data from engineering. Its various statistical properties including moments and moments based measures, hazard rate function, mean residual life function, stochastic ordering, deviations from the mean and the median, Bonferroni and Lorenz curves, and stress-strength reliability have been studied. Both the method of moment and the maximum likelihood estimation have been discussed for estimating the parameter of the proposed distribution. A numerical example has been presented to test the goodness of fit of the proposed distribution over other one parameter lifetime distributions available in statistical literature.
Keywords: lifetime distributions, statistical and mathematical properties, parameter estimation, goodness of fit
Introduction
The classical one parameter exponential distribution and Lindley distribution proposed by Lindley1 were useful for modeling lifetime data from engineering and biomedical. It has been observed by Shanker et al.2 that exponential and Lindley distributions are not suitable for several lifetime data. In search for better one parameter lifetime distributions, Shanker has introduced several one parameter lifetime distributions including Shanker,3 Aradhana,4 Sujatha,5 Devya.6 The probability density function (pdf) and the cumulative distribution function (cdf) of these distributions are presented in table 1.
Distributions |
Probability density functions and Cumulative distribution functions |
Shanker |
pdf |
|
cdf |
|
Aradhana |
pdf |
|
cdf |
|
Sujatha |
pdf |
|
cdf |
|
Devya |
pdf |
|
cdf |
|
Lindley |
pdf |
|
cdf |
|
Table 1 pdf and cdf of Shanker, Aradhana, Sujatha, Devya, and Lindley distributions for
The reasons for introducing such lifetime distributions with their advantages and disadvantages, statistical properties, parameter estimation and applications are available in the respective papers.
In this paper, a new lifetime distribution which gives better fit over several one parameter lifetime distributions are introduced. The new one parameter lifetime distribution is defined by its cdf and pdf, respectively
(1.1)
(1.2)
We name this distribution, “Adya distribution”. This is a convex combination of exponential
, gamma
and gamma
distributions. We have
Where
,
,
,
, and
;
.
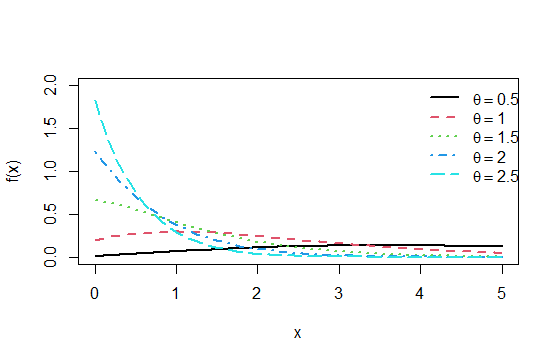
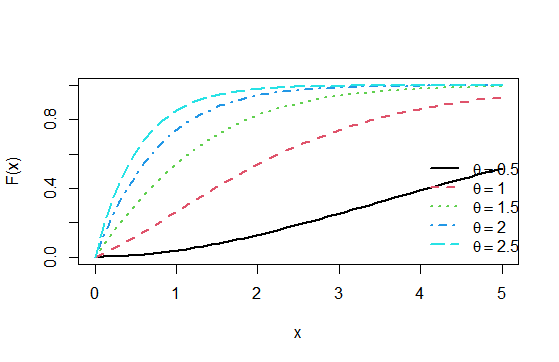
The pdf and the cdf of Adya distribution for values of the parameter
are shown in figures 1 and 2, respectively.

Figure 1 The pdf of Adya distribution .

Figure 2 The cdf of Adya distribution .
Moments and moments based measures
The
th moment about origin
of (1.2) can be obtained as
(2.1)
Substituting
in (2.1), the first four moments about origin of (1.2) are obtained as
,
,
,
Thus, the central moments of (1.2) are obtained as
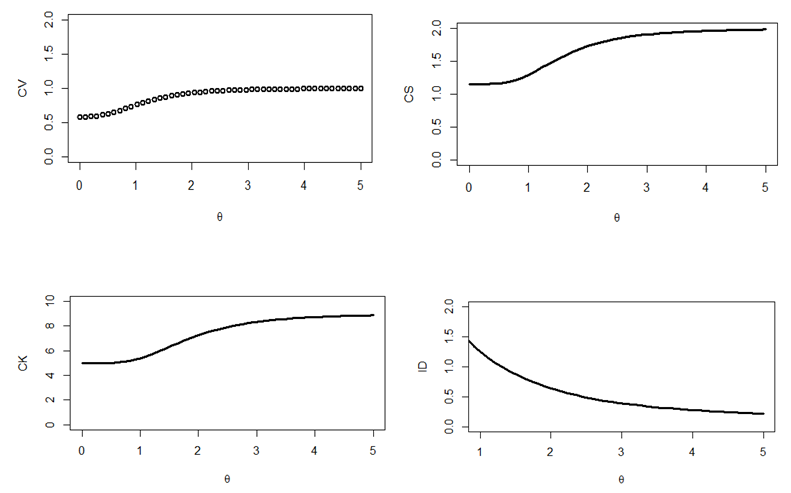
Descriptive measures including coefficient of variation
, coefficient of skweness
, coefficient of kurtosis
and index of dispersion
of (1.2) are thus obtained as
The natures of these descriptive measures for values of parameter are shown in figure 3.

Figure 3 Coefficients of variation, skewness, kurtosis and index of dispersion of Adya distribution .
The condition under which Adya distribution is over-dispersed, equi-dispersed, and under-dispersed along with condition under which Shanker, Aradhana, Sujatha, Devya, Lindley and exponential distributions are over-dispersed, equi-dispersed, and under-dispersed are presented in table 2.
Distribution |
Over-dispersion
|
Equi-dispersion
|
Under-dispersion
|
Adya |
|
|
|
Shanker |
|
|
|
Aradhana |
|
|
|
Sujatha |
|
|
|
Devya |
|
|
|
Lindley |
|
|
|
Exponential |
|
|
|
Table 2 Over-dispersion, equi-dispersion and under-dispersion of Adya, Shanker, Aradhana, Sujatha, Devya, Lindley and exponential distributions for parameter
Hazard rate function and mean residual life function
The hazard rate function and the mean residual life function of a continuous random variable
having pdf and cdf
and
are, respectively, defined as
(3.1)
and
(3.2)
Thus,
and
of (1.2) are obtained as
(3.3)
and
(3.4)
This gives
and
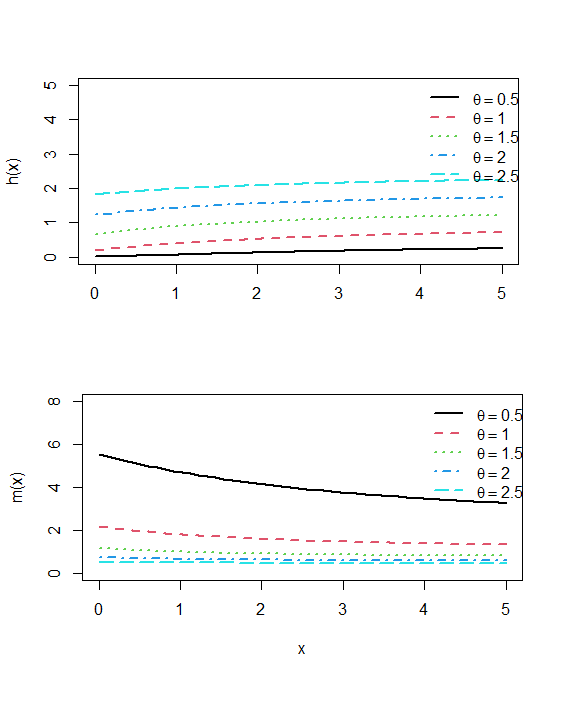
. The hazard rate function and mean residual life function of Adya distribution are shown in figure 4.

Figure 4 Graphs of
and
of Adya distribution .
Stochastic orderings
A random variable
is said to be smaller than a random variable in the
- stochastic order
if
for all
- hazard rate order
if
for all
- mean residual life order
if
for all
- likelihood ratio order
if
decreases in
Shaked and Shanthikumar7 proposed following results for establishing stochastic ordering of distributions
(4.1)
The distribution (1.2) is ordered with respect to the strongest ‘likelihood ratio’ ordering.
Theorem: Suppose
Adya distributon
and
Adya distribution
. If
, then
and hence
,
and
.
Proof: We have
Now
.
This gives
Thus for
,
. This means that
and hence
,
and
.
Mean deviations
The mean deviation about the mean and the mean deviation about the median are used to measure the amount of scatter in the population from the mean and the median and defined by
and
, respectively, where
and
. The computation of these measures are simplified as
(5.1)
and
(5.2)
Using pdf (1.2) and expression for the mean of Adya distribution ,we get
(5.3)
(5.4)
Using expressions from (5.1), (5.2), (5.3), and (5.4), the mean deviation about mean, and the mean deviation about median, of Adya distribution are obtained as
(5.5)
(5.6)
Bonferroni and lorenz curves
The Bonferroni8 and Lorenz curves are defined as
(6.1)
and
(6.2)
respectively or equivalently
(6.3)
and
(6.4)
respectively, where
and
.
The Bonferroni and Gini indices are thus defined as
(6.5)
and
(6.6)
respectively.
Using pdf (1.2), we have
(6.7)
Now using equation (6.7) in (6.1) and (6.2), we have
(6.8)
and
(6.9)
Now using equations (6.8) and (6.9) in (6.5) and (6.6), the Bonferroni and Gini indices are obtained as
(6.10)
(6.11)
Stress-strength reliability
Suppose
and
be independent strength and stress random variables having Adya distribution with parameter
and
respectively. Then
is known as stress-strength parameter and is a measure of the component reliability.
Thus,
Estimation of parameter
Estimation using method of moment
Since Adya distribution has one parameter, equating the population mean to the corresponding sample mean, the moment estimate
of
is the solution of the following fifth degree polynomial equation
, where
is the sample mean.
Estimation using maximum likelihood estimation
Taking
a random sample from (1.2), the natural log likelihood function of Adya distribution is
.
This gives,
,
The MLE
of
is the solution of
which is given by
.
This non-linear equation is not in compact form and its solution can be obtained analytically. We have to use non-linear optimization technique such as quasi-Newton algorithm available in R software to maximize the log-likelihood function.
A simulation study
A simulation study has been conducted to examine the performance of the maximum likelihood estimate (MLE) of the parameter of Adya distribution. Random number
and 80 generated corresponding to the parameter
and 0.5 using Acceptance- Rejection method. Its Bias and Mean Square Error have been calculated and presented in the table 3.
n |
|
Bias (
) |
MSE(
) |
20 |
0.1 |
0.01200 |
0.00288 |
0.2 |
0.021244 |
0.009028 |
0.3 |
0.018753 |
0.007033 |
0.4 |
0.023497 |
0.0110371 |
40 |
0.1 |
0.004884 |
0.000954 |
0.2 |
0.007587 |
0.002302 |
0.3 |
0.008900 |
0.003168 |
0.4 |
0.010251 |
0.0042034 |
60 |
0.1 |
0.003484 |
0.000728 |
0.2 |
0.005428 |
0.001768 |
0.3 |
0.005854 |
0.002056 |
0.4 |
0.006242 |
0.002338 |
80 |
0.1 |
0.0023048 |
0.000424 |
0.2 |
0.0038444 |
0.001182 |
0.3 |
0.004266 |
0.001456 |
0.4 |
0.004735 |
0.001794 |
Table 3 Average Bias and Average Mean Square Error of simulated MLE (
) for fixed values
=0.1,0.2,0.3 &0.4
Data analysis
The data set considered for the goodness of fit of Adya distribution is the strength data of glass of the aircraft window reported by Fuller et al.9 and are given as
18.83, 20.80, 21.657, 23.03, 23.23, 24.05, 24.321, 25.50, 25.52, 25.80, 26.69, 26.77, 26.78, 27.05, 27.67, 29.90, 31.11, 33.20, 33.73, 33.76, 33.89, 34.76, 35.75, 35.91, 36.98, 37.08, 37.09, 39.58, 44.045, 45.29, 45.381
The goodness of fit of the distributions are based on the values of
, AIC (Akaike Information Criterion) and K-S (Kolmogorov-Smirnov) statistic. AIC and K-S are computed using,
,
where
= the number of parameters,
= the sample size and
is the empirical distribution function. The distribution having lower
, AIC , and K-S are said to be best distribution. The MLE
and standard error, S.E
of
,
, AIC, K-S and p-value of the fitted distributions are presented in the table 4.
Distributions |
MLE
|
S.E
|
|
AIC |
K-S |
p-value |
Adya |
0.096970 |
0.01000 |
240.63 |
242.63 |
0.298 |
0.006 |
Shanker |
0.647164 |
0.008200 |
252.35 |
254.35 |
0.358 |
0.0004 |
Aradhana |
0.094319 |
0.009780 |
242.22 |
244.22 |
0.306 |
0.0044 |
Sujatha |
0.095613 |
0.009904 |
241.50 |
243.50 |
0.303 |
0.0051 |
Devya |
0.160873 |
0.012916 |
227.68 |
229.68 |
0.422 |
0.0000 |
Lindley |
0.062992 |
0.008001 |
253.98 |
255.98 |
0.365 |
0.0003 |
Exponential |
0.032449 |
0.005822 |
274.52 |
276.53 |
0.458 |
0.0000 |
Table 4 MLE’s, S.E
, AIC and K-S Statistics of the fitted distributions of the given data set
Clearly Adya distribution gives better fit than Shanker, Aradhana, Sujatha, Devya, Lindley and exponential distributions.
Concluding remarks
Adya distribution, a one parameter lifetime distribution, for modeling lifetime data has been presented and studied. The statistical properties including coefficient of variation, skewness, kurtosis, index of dispersion, hazard rate function, mean residual life function, stochastic ordering, mean deviations, Bonferroni and Lorenz curves and stress-strength reliability have been discussed. Over-dispersed, equi-dispersed, and under-dispersed of Adya distribution are presented. Method of moment and method of maximum likelihood are explained for estimating parameter. The asymptotic property of the ML estimate of the parameter has been discussed with simulation study. Finally, the goodness of fit test has been presented with a real lifetime data.
NOTE: The paper is named Adya distribution in the name of my loving niece Adya Vedanshi, the daughter of my younger brother Dr. Ravi Shanker.
Acknowledgement
Conflicts of interest
All authors declare that there is no conflict of interest.
References
- Lindley DV. Fiducial distributions and Bayes’ theorem, Journal of the Royal Statistical Society, Series B. 1958;20:102‒107.
- Shanker R, Hagos F, and Sujatha S. On modeling of lifetimes data using and lindley distributions, Biometrics & Biostatistics International Journal. 2015;2(5):1‒9.
- Shanker R. Shanker distribution and its Applications, International Journal of Statistics and Applications. 2015;5(6):338‒348.
- Shanker R. Aradhana distribution and its Applications, International Journal of Statistics and Applications. 2016;6(1):23–34.
- Shanker R. Sujatha distribution and its Applications, Statistics in Transition- new series. 2016;17(3):391‒410.
- Shanker R. Devya distribution and its Applications, International Journal of Statistics and Applications. 2016;6(4):189–202.
- Shaked M, Shanthikumar JG. Stochastic orders and their applications, Academic Press, New York; 1994.
- Bonferroni CE. On a sum and difference of two quasi lindley distributions: Theory and applications. Elementi di Statistca generale, Seeber, Firenze. 1930;9(1):12–23.
- Fuller EJ, Frieman S, Quinn J, et al. Fracture mechanics approach to the design of glass aircraft windows: A case study, SPIE Proc. 1994;2286:419‒430.

©2021 Shanker, et al. This is an open access article distributed under the terms of the,
which
permits unrestricted use, distribution, and build upon your work non-commercially.


