
Research Article Volume 11 Issue 4
A new method for identifying significant genes from gene expression data
Yiwen Cao,1
Regret for the inconvenience: we are taking measures to prevent fraudulent form submissions by extractors and page crawlers. Please type the correct Captcha word to see email ID.

Jiajuan Liang,1,2  Na Gao,3 Zengrong Sun3
1 Department of Statistics and Data Science, BNU-HKBU, United International College, China
2Guangdong Provincial Key Laboratory of Interdisciplinary Research and Application for Data Science, United International College, China
3School of Public Health, Tianjin Medical University, China
Correspondence: Jiajuan Liang, Department of Statistics and Data Science, United International College, Zhuhai, China
Received: November 07, 2022 | Published: November 23, 2022
Citation: Cao Y, Liang J, Gao N, et al. A new method for identifying significant genes from gene expression data. Biom Biostat Int J. 2022;11(4):140-146. DOI: 10.15406/bbij.2022.11.00368
Download PDF
Abstract
Testing the significance of a medical treatment on experimental subjects is very common in medical data analysis. Classical methods like the traditional analysis of variance usually assume variance homogeneity across treatments or experimental groups of subjects. However, this assumption is often violated if there exists fundamental difference between experimental groups like male and female groups of patients. In this paper, we propose to use a theoretically proved exact -test for testing the significance of a medical treatment for subjects before and after the treatment. This new exact -test is applicable regardless of variance homogeneity across groups. An illustration based on real experimental data from treatments on rats shows that the new exact -test gives more convincing results than those from the traditional analysis of variance.
Keywords: analysis of variance; -test; gene expression data; multiple mean comparison
Introduction
The significance of responses from a gene before and after an experiment can be tested by statistical methods for multiple mean comparison. While the traditional two-sample Student’s -test has been employing for comparison between two normal population means, it is assumed that the two populations have equal variances. This condition may not be always satisfied if a group of genes are correlated. Although unequal-variance two-sample -test was proposed to handle the two-sample mean comparison, it only provides an approximate solution. A natural extension to the two-sample -test for a comparison between two means is the one-way (single-factor) analysis of variance (ANOVA), which is also based on the assumption of equal variances across the populations from which the means are compared. If the equal-variance assumption is not satisfied, the conclusion from one-way ANOVA is doubtable. For example, a study on a comparison between the mean responses from different genes of rats before and after an experiment is given by Gao et al.1 The purpose of the study is to find out which gene has a significant change between the mean responses of each rat. In the experiment, 24 pregnant rats were randomly assigned to four groups (sample size per group) and treated with corn oil (vehicle control), 2, 10 or 50 mg/kg DEHP (Alfa Aesar). The response data from the three experiments with different doses of corn oil were collected. Under each dose, the experimental purpose is to see which gene shows a significant change before and after the experiment. This is a kind of representative experiments in medical research for identifying the significant effect from a treatment. Under the classical equal-variance normal assumption, the solution is obvious the two-sample -test for comparing the different effects from two doses, and the one-way ANOVA is employed for comparing the different effects from three or more doses. When the classical equal-variance assumption is known to be violated, there are some approximate methods available for a multiple mean comparison.2–7 In addition to comparing the mean difference between before and after treatment for each gene, there are many other methods for analysis of gene expression data in the literature.8–14
In this paper, we will employ a new exact -distribution-based method for the multiple mean comparison for gene-experiment data under the normal assumption on the sample data. The new exact -test does not depend on the equal-variance assumption across groups. This implies that the new -test will be especially suitable for the multiple mean comparison with known variance heterogeneity across groups. We give a summary review on the basic statistical theory for the new -test in Section 4. Details on the new -test can be referred to Liang et al.15 Section 5 presents the application of the new -test to significant gene identification compared to the classical one-way ANOVA method. Some concluding remarks are given in the last section.
A simple review on the new
-test
Assume that there is a balanced sample design (with an equal sample size across the normal populations) to obtain i.i.d. (independent identically distributed) samples
from the normal distribution
for each population
. Here it is also assumed that samples from different populations
and
are also independent. We want to test the hypothesis of multiple mean comparison:
(1)
Randomly selecting a population as population , we construct the observation matrix
(2)
- Theorem. Let the observation matrix be given by (1.8). Define the following eigenvalue-eigenvector problem:15
(3)
where
for
with
being the number of positive eigenvalues
in (1.9).
Define
(4)
for . Under the null hypothesis (1),
has an exact
-distribution
for
.
Each of the
-statistic given by (4) can be employed to test the hypothesis (1). For any given
, reject the null hypothesis in (1) at a given level
for a large value of
, which stands for the
-percentile of the traditional
-distribution
. We suggest using the
-statistic
in (4) associated with the largest eigenvalue in (3) based on the Monte Carlo study in Liang et al.15 The -test is called the PCA-test (principal component test).
Application of the exact
-test
A research project was carried out by Tianjin Medical University, China.1 Rats were collected for experiment by four different treatments (doses) to see the treatment effects from 46 genes with sample size
(rats) for each treatment. In the experiment on 6 rats, the ratio of organ wet weight to body weight (organ coefficient) was observed. The purpose is to evaluate organ development during the treatment. Details on the experiment and medical analysis can be found in Gao et al.1 In one-way ANOVA, we can consider each factor level as a group or population. In the experiment on 6 male rats with 46 levels (genes), we consider if the ratio of organ wet weight to body weight has changed during the treatment.
Let
(5)
for . Then we need to test the hypothesis
(6)
For each of the two groups of rats with four treatments, we employ the Bartlett test for variance homogeneity before and after the treatments.16 The -values for testing homogeneity for those genes with significance at levels
and
are given in Tables 1–3 from the two groups of rats. It shows that there exists significant variance heterogeneity for those genes before and after the treatment. This implies that if one continues using the traditional ANOVA (analysis of variance) method for testing the significance of the genes after the treatment, the conclusion is doubtable because the data show a violation of variance homogeneity.
Genes |
Avp |
Dbp |
Drd1a |
Gh1 |
Ghrh |
Igf1 |
p-value |
.0062 |
.0002 |
.0294 |
0 |
.0074 |
.0011 |
Genes |
Kiss1r |
Lepr |
Cyp19a1 |
Nkx2-1 |
Pomc |
|
p-value |
.0056 |
.0000 |
.0542 |
.0045 |
0.000 |
|
Table 1 p-values for testing homogeneity for genes in group male-neonatal
Genes |
Avp |
Bdnf |
Crh |
Crhr1 |
Drd1a |
Gh1 |
p-value |
.0000 |
.0072 |
.0030 |
.0542 |
.0051 |
.0000 |
Genes |
Grin2a |
Mtnr1a |
Oxt |
Oxtr |
Pgr |
Tacr3 |
p-value |
0.0213 |
.0000 |
.0000 |
.0000 |
.0463 |
.0011 |
Table 2 p-values for testing homogeneity for genes in group male-ARC
Genes |
Drd1a |
Drd2 |
Gh1 |
Ghrh |
Gper |
Grin2a |
p-value |
.0235 |
.0000 |
.0000 |
.0047 |
.0092 |
.0000 |
Genes |
Mtnr1b |
Npy |
Pomc |
Tac2 |
Tacr3 |
|
p-value |
.0259 |
.0036 |
.0003 |
.0377 |
.0001 |
|
Table 3 p-values for testing homogeneity for genes in group male-AVPV
We apply both the classical one-way ANOVA
-test and the new exact
-test
in (4) (called PCA -test) to testing the significance for the genes in three groups. The -values from the two tests are summarized in Tables 4–7 below. The following conclusions can be summarized:
Genes |
Ar |
Arntl |
Avp |
Avpr1a |
Bdnf |
Clock |
Crh |
ANOVA-F |
.3073 |
.0152 |
.4923 |
.573 |
.6385 |
.8592 |
.6671 |
PCA-F |
.0324 |
.0445 |
.2663 |
.3545 |
.4595 |
.6501 |
.5668 |
Genes |
Crhr1 |
Crhr2 |
Dbp |
Drd1a |
Drd2 |
Esr1 |
Esr2 |
ANOVA-F |
.6914 |
.1955 |
.7558 |
.1906 |
.8552 |
.9505 |
.0244 |
PCA-F |
0.5876 |
.0203 |
.4652 |
.097 |
.7526 |
.8538 |
.041 |
Genes |
Gh1 |
Ghrh |
Gper |
Grin1 |
Grin2a |
Grin2b |
Grin2d |
ANOVA-F |
.4179 |
.9457 |
.3892 |
.1939 |
.5434 |
.7007 |
.3738 |
PCA-F |
.3631 |
.6833 |
.2926 |
.194 |
.3387 |
.3057 |
.4023 |
Genes |
Hcrtr2 |
Igf1 |
Igf1r |
Kiss1 |
Kiss1r |
Lepr |
Cyp19a1 |
ANOVA-F |
.2066 |
.8900 |
.2030 |
.9091 |
.3700 |
.7010 |
.2118 |
PCA-F |
.0036 |
.5683 |
.1657 |
.6052 |
.2589 |
.4588 |
.0239 |
Genes |
Mc3r |
Mtnr1a |
Mtnr1b |
Nkx2-1 |
Npy |
Nr3c1 |
Oxt |
ANOVA-F |
.3918 |
.0745 |
.7636 |
.2333 |
.8120 |
.9236 |
.4260 |
PCA-F |
.2086 |
.0091 |
.4700 |
.2107 |
.4419 |
.6632 |
.1254 |
Genes |
Oxtr |
Pdyn |
Per1 |
Per2 |
Pgr |
Pomc |
Slc17a6 |
ANOVA-F |
.8607 |
.4441 |
.3191 |
.0534 |
.1953 |
.3404 |
.0708 |
PCA-F |
.7419 |
.1702 |
.1874 |
.0373 |
.1394 |
.3162 |
.0148 |
Genes |
Sst |
Tac2 |
Tacr3 |
Trh |
|
|
|
ANOVA-F |
.7489 |
.4924 |
.1086 |
.3043 |
|
|
|
PCA-F |
.3707 |
.1928 |
.0816 |
.0871 |
|
|
|
Table 4 p-values for testing significance for genes in group male-neonatal
Genes |
Ar |
Arntl |
Avp |
Avpr1a |
Bdnf |
Clock |
ANOVA-F |
.2738 |
.6888 |
.3234 |
.8551 |
.6795 |
.5743 |
PCA-F |
.1571 |
.3826 |
.1975 |
.4207 |
.3934 |
.3208 |
Genes |
Crh |
Crhr1 |
Crhr2 |
Dbp |
Drd1a |
Drd2 |
ANOVA-F |
.1842 |
.3629 |
.6945 |
.9889 |
.5464 |
.7514 |
PCA-F |
.2447 |
.2159 |
.3823 |
.8757 |
.2261 |
.4878 |
Genes |
Esr1 |
Esr2 |
Gh1 |
Ghrh |
Gper |
Grin1 |
ANOVA-F |
.0221 |
.0722 |
.4098 |
.0966 |
.7448 |
.7226 |
PCA-F |
.0069 |
.0485 |
.3612 |
.0432 |
.4959 |
.4386 |
Genes |
Grin2a |
Grin2b |
Grin2d |
Hcrtr2 |
Igf1 |
Igf1r |
ANOVA-F |
.5232 |
.9309 |
.6604 |
.3190 |
.6347 |
.7416 |
PCA-F |
.4889 |
.5286 |
.2644 |
.1584 |
.4042 |
.4538 |
Genes |
Kiss1 |
Kiss1r |
Lepr |
Cyp19a1 |
Mc3r |
Mtnr1a |
ANOVA-F |
.3503 |
.4138 |
.3043 |
.2991 |
.2582 |
.5545 |
PCA-F |
.3023 |
.7061 |
.2564 |
.2454 |
.3977 |
.3466 |
Genes |
Mtnr1b |
Nkx2-1 |
Npy |
Nr3c1 |
Oxt |
Oxtr |
ANOVA-F |
.1711 |
.3207 |
.0029 |
.6746 |
.2143 |
.3939 |
PCA-F |
.0562 |
.3647 |
.0190 |
.3246 |
.1696 |
.2914 |
Genes |
Pdyn |
Per1 |
Per2 |
Pgr |
Pomc |
Slc17a6 |
ANOVA-F |
.5596 |
.5897 |
.8595 |
.2314 |
.3705 |
.4243 |
PCA-F |
.5191 |
.5415 |
.4891 |
.1275 |
.2689 |
.3281 |
Genes |
Sst |
Tac2 |
Tacr3 |
Trh |
|
|
ANOVA-F |
.6276 |
.3626 |
.6251 |
.5534 |
|
|
PCA-F |
.7813 |
.4330 |
.3860 |
.2318 |
|
|
Table 5 p-values for testing significance for genes in group male-ARC
Genes |
Ar |
Arntl |
Avp |
Avpr1a |
Bdnf |
Clock |
Crh |
ANOVA-F |
.7509 |
.2764 |
.7339 |
.1999 |
.2555 |
.9345 |
.8701 |
PCA-F |
.2708 |
.5035 |
.5116 |
.1643 |
.2446 |
.5705 |
.5202 |
Genes |
Crhr1 |
Crhr2 |
Dbp |
Drd1a |
Drd2 |
Esr1 |
Esr2 |
ANOVA-F |
.0136 |
.0610 |
.4226 |
.6432 |
.1514 |
.5466 |
.9320 |
PCA-F |
.0107 |
.0250 |
.2781 |
.3535 |
.2012 |
.1871 |
.7808 |
Genes |
Gh1 |
Ghrh |
Gper |
Grin1 |
Grin2a |
Grin2b |
Grin2d |
ANOVA-F |
.4493 |
.6673 |
.3409 |
.6511 |
.2186 |
.3453 |
.2355 |
PCA-F |
.3825 |
.6800 |
.0505 |
.3143 |
.2644 |
.0805 |
.4195 |
Genes |
Hcrtr2 |
Igf1 |
Igf1r |
Kiss1 |
Kiss1r |
Lepr |
Cyp19a1 |
ANOVA-F |
.1491 |
.3570 |
.1444 |
.3790 |
.8003 |
.1226 |
.4710 |
PCA-F |
.0502 |
.1385 |
.1944 |
.2156 |
.4514 |
.0928 |
.1250 |
Genes |
Mc3r |
Mtnr1a |
Mtnr1b |
Nkx2-1 |
Npy |
Nr3c1 |
Oxt |
ANOVA-F |
.6769 |
.5237 |
.2324 |
.8186 |
.7305 |
.4726 |
.9267 |
PCA-F |
.5365 |
.4859 |
.0508 |
.8017 |
.3902 |
.2611 |
.9816 |
Genes |
Oxtr |
Pdyn |
Per1 |
Per2 |
Pgr |
Pomc |
Slc17a6 |
ANOVA-F |
.8586 |
.9684 |
.4784 |
.8736 |
.9046 |
.7508 |
.6924 |
PCA-F |
.5902 |
.7579 |
.1905 |
.5027 |
.6225 |
.4901 |
.3291 |
Genes |
Sst |
Tac2 |
Tacr3 |
Trh |
|
|
|
ANOVA-F |
.2935 |
.8648 |
.0993 |
.9017 |
|
|
|
PCA-F |
.3589 |
.7606 |
.1528 |
.7711 |
|
|
|
Table 6 p-values for testing significance for genes in group male-AVPV
Genes |
Ar |
Arntl |
Avp |
Avpr1a |
Bdnf |
Clock |
ANOVA-F |
.1539 |
.4363 |
.0157 |
.3085 |
.2654 |
.2786 |
PCA-F |
.0373 |
.2631 |
.0019 |
.1560 |
.0835 |
.1930 |
Genes |
Crh |
Crhr1 |
Crhr2 |
Dbp |
Drd1a |
Drd2 |
ANOVA-F |
.5818 |
.6505 |
.4481 |
.8795 |
.5372 |
.7997 |
PCA-F |
.1744 |
.2764 |
.1376 |
.5565 |
.1448 |
.5654 |
Genes |
Esr1 |
Esr2 |
Gh1 |
Ghrh |
Gper |
Grin1 |
ANOVA-F |
.3685 |
.7953 |
.4393 |
.6965 |
.9670 |
.4227 |
PCA-F |
.2178 |
.4330 |
.3175 |
.3349 |
.9512 |
.3256 |
Genes |
Grin2a |
Grin2b |
Grin2d |
Hcrtr2 |
|
|
ANOVA-F |
.3246 |
.9973 |
.8915 |
.0244 |
|
|
PCA-F |
.0202 |
.8985 |
.6386 |
.0657 |
|
|
Genes |
Igf1 |
Igf1r |
Kiss1 |
Kiss1r |
Lepr |
Cyp19a1 |
ANOVA-F |
.7253 |
.2116 |
.4614 |
.7769 |
.4248 |
.2284 |
PCA-F |
.4271 |
.1766 |
.2922 |
.6023 |
.2213 |
.0263 |
Genes |
Mc3r |
Mtnr1a |
Mtnr1b |
Nkx2-1 |
Npy |
Nr3c1 |
ANOVA-F |
.6119 |
.4281 |
.3589 |
.7073 |
.7314 |
.6476 |
PCA-F |
.3823 |
.3642 |
.3105 |
.4190 |
.4107 |
.4370 |
Genes |
Oxt |
Oxtr |
Pdyn |
Per1 |
Per2 |
Pgr |
ANOVA-F |
.9217 |
.6444 |
.3707 |
.6318 |
.5211 |
.3892 |
PCA-F |
.5645 |
.4699 |
.1437 |
.4065 |
.3449 |
.3447 |
Genes |
Pomc |
Slc17a6 |
Sst |
Tac2 |
Tacr3 |
Trh |
ANOVA-F |
.7911 |
.3327 |
.6869 |
.2291 |
.1424 |
.4648 |
PCA-F |
.4319 |
.1467 |
.3772 |
.1567 |
.0850 |
.2366 |
Table 7 p-values for testing significance for genes in group Male-MPN
1) the red-colored genes with red
-values are significant based on both ANOVA
-test and PCA
-test for level
;
2) the red-colored genes with a red
-value and a green-colored -value is significant based on PCA
-test for
or
but insignificant based on ANOVA
-test. Some of the genes are significant based on ANOVA
-test for
;
3) the ANOVA F-test fails to identify several significant genes at level
or
- those genes with red or green-colored p-values in Tables 4-7: genes Ar, Crhr2, Drd1a, Hcrtr2, Cyp19a1, Tacr3, and Trh in Table 4, Mtnr1b in Table 5, genes Gper, Grin2b, Hcrtr2, Lepr, and Mtnr1b in Table 6, genes Ar, Bdnf, Grin2a, Cyp19a1, and Tacr3 in Table 7.
The following box plots indicate there exists variance heteroscedasticity across different treatment groups. This means that the PCA-F test gives more convincing conclusions when testing the mean difference. Furthermore, the ANOVA fails to identify quite a few of significant genes.
Figures(1–4b)
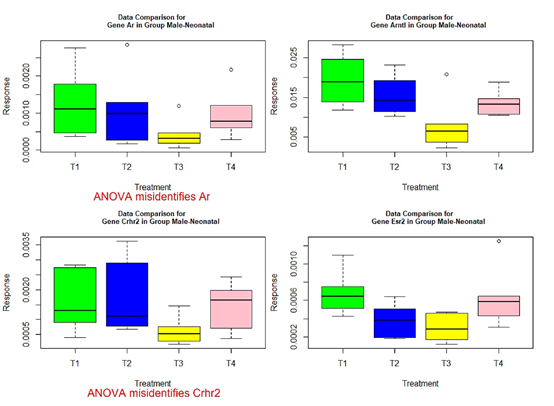
Figure 1 Box plots for four significant genes in group male-neonatal.
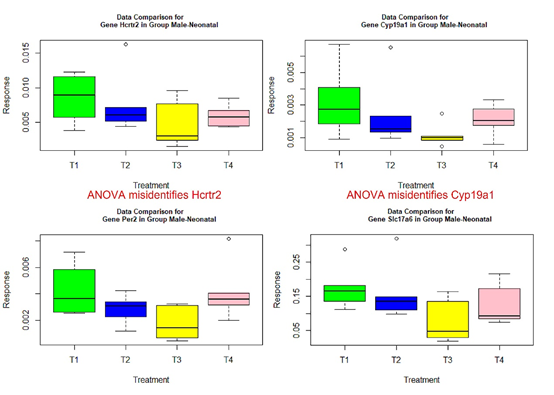
Figure 1 Box plots for four significant genes in group male-neonatal.
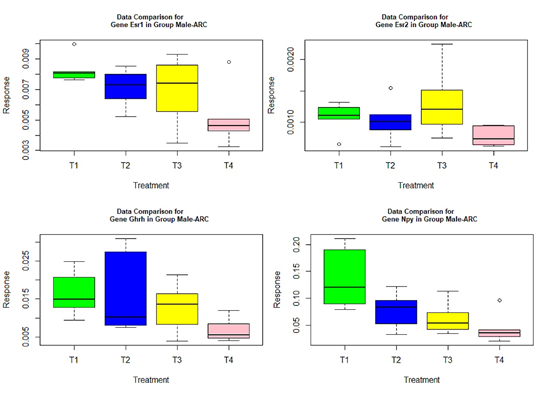
Figure 2 Box plots for four significant genes in group male-ARC.
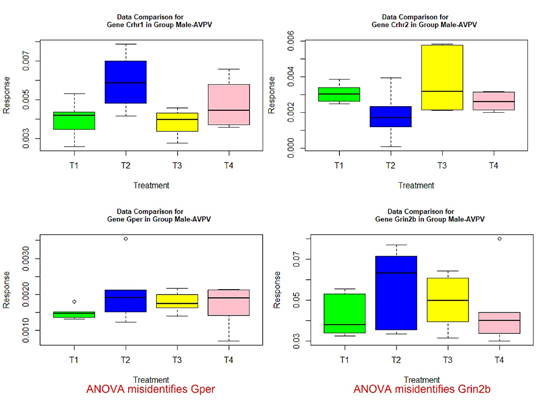
Figure 3 Box plots for four significant genes in group male-AVPV.
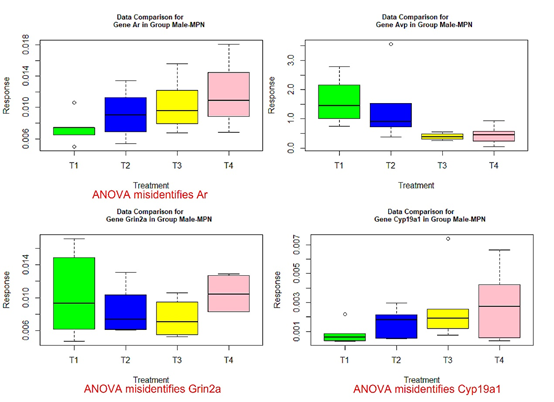
Figure 4 Box plots for four significant genes in group male-MPN.
Concluding remarks
The new exact -test in this paper is applicable for multiple mean comparisons without assuming homogeneity of variances across the populations. It is especially suitable for matched pair mean comparison in the situation of before and after treatments in medical research. When different experimental subjects show different responses to the treatments, it is very likely that there exists variance heterogeneity across the treatments. As a result, conclusions from the traditional ANOVA -test or the classical two-sample -test are doubtable. While there exists approximate solutions to the problem of two-sample mean comparison with heterogeneous variances, for example, Welch’s2 approximate -test, and Dudewicz et al.7 method for an exact solution to the Behrens-Fisher problem, these methods are either based on the approximate null distribution of the test statistics or based on approximate computation of the -values. The method based on the new exact -test in this paper provides an accurate solution to the problem of two normal population mean comparison without any restriction on the population variances. The real data analysis shows the new exact -test could detect some situations of mean difference for which the traditional ANOVA -test fails. Therefore, the method based on the new exact -test in this paper is recommended to be used together with some existing methods for the same purpose in problems of multiple mean comparisons.17–19
Conclusion
The new exact -test in this paper is applicable for multiple mean comparisons without assuming homogeneity of variances across the populations. It is especially suitable for matched pair mean comparison in the situation of before and after treatments in medical research. When different experimental subjects show different responses to the treatments, it is very likely that there exists variance heterogeneity across the treatments. As a result, conclusions from the traditional ANOVA -test or the classical two-sample -test are doubtable. While there exists approximate solutions to the problem of two-sample mean comparison with heterogeneous variances, for example, Welch’s2 approximate -test, and Dudewicz et al.7 method for an exact solution to the Behrens-Fisher problem, these methods are either based on the approximate null distribution of the test statistics or based on approximate computation of the -values. The method based on the new exact -test in this paper provides an accurate solution to the problem of two normal population mean comparison without any restriction on the population variances. The real data analysis shows the new exact -test could detect some situations of mean difference for which the traditional ANOVA -test fails. Therefore, the method based on the new exact -test in this paper is recommended to be used together with some existing methods for the same purpose in problems of multiple mean comparisons.17–1
Acknowledgments
This work was partially supported by a UIC New Faculty Start-up Research Fund R72021106, and in part by the Guangdong Provincial Key Laboratory of Interdisciplinary Research and Application for Data Science, BNU-HKBU United International College (UIC), project code 2022B1212010006.
Conflicts of interest
The authors declare that there are no conflicts of interest.
References
- Gao N, Hu R, Huang Y, et al. Specific effects of prenatal DEHP exposure on neuroendocrine gene expression in the developing hypothalamus of male rats. Arch Toxicol. 2018;92(1):501–512.
- Welch BL. The generalization of Student’s problem when several different population variances are involved. Biometrika. 1947;34(1–2):28–35.
- Turkey JW. Comparing individual means in the analysis of variance. Biometrics.1949;5(2):99–114.
- Kramer CY. Extension of multiple range tests to group means with unequal numbers of replications. Biometrics. 1956;12(3):307–310.
- Best DJ, Rayner JCW. Welch’s approximate solution for the Behrens-Fisher problem. Technometrics. 1987;29(2):205–210.
- Kruskal WH, Wallis WA. Use of ranks in one-criterion variance analysis. J Amer Statist Assoc. 1952;47(260):583–621.
- Dudewicz EJ, Ma Y, Mai E, et al. Exact solutions to the Behrens-Fisher problem: asymptotically optimal and finite sample efficient choice among. J Statist Plann & Infer. 2007;137(5):1584–1605.
- Törönen P, Kolehmainen M, Wong G, et al. Analysis of gene expression data using self-organizing maps. FEBS Letters. 1999;451(2):142–146.
- Brazma A, Vilo J. Minireview: Gene expression data analysis. FEBS Letters. 2000;480(2000):17–24.
- Sherlock G. Analysis of large-scale gene expression data. Current Opinion in Immunology. 2000;12(2):201–205.
- Yeung KY, Ruzzo W L. Principal component analysis for clustering gene expression data. Bioinformatics. 2001;17(9):763–774.
- Slonim DK. From patterns to pathways: gene expression data analysis comes of age. Nature Genetics Supplement. 2002;32:502–508.
- Parmigiani G, Garrett ES, Irizarry RA, et al. The Analysis of Gene Expression Data: An Overview of Methods and Software. Springer: 2003.
- Wolf FE, Angerer P, Theis FJ. SCANPY: large-scale single-cell gene expression data analysis. Genome Biology. 2018;19:15.
- Liang J, Tang ML, Yang J, et al. An application of the theory of spherical distributions in multiple mean comparison. In: Fan J, Pan J, editors. Contemporary Experimental Design, Multivariate Analysis and Data Mining - Festschrift in Honour of Professor Kai-Tai Fang. Springer-Verlag; 2020;189–199.
- Bartlett MS. Properties of sufficiency and statistical tests. Proc Roy Statist Soc. (Ser. A). 1937;160:268–282.
- Brown MB, Forsythe AB. Robust tests for the equality of variances. J Amer Statist Assoc. 1974;69(346):364–367.
- Fang KT, Kotz S, Ng KW. Symmetric Multivariate and Related Distributions. Chapman and Hall Ltd. London and New York;1990.
- Fang KT, Zhang YT. Generalized Multivariate Analysis. Science Press and Springer-Verlag. Beijing and Berlin;1990.

©2022 Cao, et al. This is an open access article distributed under the terms of the,
which
permits unrestricted use, distribution, and build upon your work non-commercially.


