Advances in
eISSN: 2377-4290


Opinion Volume 15 Issue 2
Assistant Professor of Ophthalmology, Kasr Al-Ainy, Cairo University, Egypt
Correspondence: Randa Mohamed Abdel-Moneim El-Mofty, Assistant Professor of Ophthalmology, Kasr Al-Ainy, Cairo University, Cairo, Egypt
Received: March 13, 2025 | Published: May 27, 2025
Citation: El-Mofty RMAM. Clinical electrophysiology of vision and glaucoma: a glance. Adv Ophthalmol Vis Syst. 2025;15(2):36-38. DOI: 10.15406/aovs.2025.15.00482
Glaucoma is an optic neuropathy characterized by retinal ganglion cells (RGC) degeneration associated with visual field defects. Though conventional structural and functional assessments, such as optical coherence tomography (OCT) and perimetry, are essential for diagnosis, clinical electrophysiology of vision can offer a valuable understanding of the pathophysiology of the glaucomatous damage. This article highlights the role of electrophysiological testing in early detection of glaucoma and monitoring disease progression.
Keywords: glaucoma, electrophysiology, pattern electroretinogram, visual evoked potential, photopic negative response, retinal ganglion cells, early diagnosis
Glaucoma is a leading cause of irreversible blindness worldwide, necessitating early detection and effective monitoring plans. Clinical electrophysiology of vision plays an additional role offering functional insights before structural damage becomes evident.1,2
Diagnosis of glaucoma is based on the IOP values, optic nerve head appearance in fundus examination, visual field assessment (VFA) for typical glaucomatous field defects, gonioscopy and pachymetry, with invaluable data also from SD-OCT regarding retinal fiber layer thickness (RNFL) and ganglion cell layer thickness (GCC).3 OCT can assess the anatomical variations and can precede the Visual field glaucomatous changes by almost 6 years.4
Perimetry assesses function in a subjective manner, considering individual knowledge and expertise, as well as the agreement among experts.5
In Glaucoma, early detection of the disease and its progression is extremely critical.6 Early diagnosis by electrophysiological tests, particularly in pre-perimetric glaucoma, can provide an objective, quantitative functional evaluation of RGC function, making them valuable tools for monitoring disease progression and evaluating efficacy of treatment.
Pattern electroretinogram (PERG): The pattern electroretinogram (PERG) is a localized retinal response to a contrast-reversing pattern checkerboard which provides information about macular and retinal ganglion cell function. PERG waveform typically has a small initial negative component with a peak time of approximately 35 ms (N35), followed by a much larger positive component with a peak time in the region of 50 ms (P50) which is followed by a larger negative component with a mean peak time in the region of 95 ms (N95).7
PERG reflects electrical activity of the central RGCs with a high sensitivity to early RGC dysfunction before the occurrence of detectable visual field defects.8 In glaucoma suspects, PERG signal anticipates an equivalent loss of OCT signal by several years.9
Photopic negative response (PhNR): The photopic negative response (PhNR) of the light-adapted full-field ERG represents a slow negative-going wave after the b-wave that can provide information about the generalized function of retinal ganglion cells and their axons. Reduction of the PhNR amplitude can reflect glaucoma severity and can serve as a biomarker for early detection and disease monitoring.10–12 In glaucoma suspect, reduced PhNR amplitude may be a useful and sensitive test in eyes in the diagnostic dilemma, however further follow-up is needed for conclusive confirmation (Figure 1).13
Multifocal electroretinogram (mfERG): The multifocal electroretinogram (mfERG) allows to evaluate the function of multiple distinct areas of the retina assessed simultaneously.15
MfERG assesses localized retinal function by recording responses from different retinal regions. N2 response in the central area showing altered amplitudes and implicit times could be able to detect pre-perimetric glaucoma and can be effective predictors in early glaucoma diagnosis.16
Visual Evoked Potential (VEP): The international society of clinical electrophysiology of Vision (ISCEV) standard VEP protocols describe a single recording channel with a midline occipital active electrode. They assess the prechiasmal function.17
VEP is a valuable for evaluating the optic nerve function, with the advantage of being completely objective. Altered amplitudes and peak times in glaucoma can be an important early detector of optic nerve dysfunction. Gravity of glaucomatous damage can be correlated to the delayed latencies of VEP due to retina-visual cortex transfer interruption.3
PVEP can detect functional damage before any detected glaucomatous visual field defects.18 In Glaucoma suspects and early, PERG can detect early retinal ganglion cell (RGC) dysfunction; peak time delay of N95 is present in Glaucoma suspects and early primary open angle glaucoma (POAG), additionally in POAG there is a reduction in N95 amplitude.19
In cases of ocular hypertension and OAG, a delayed PERG P50 peak time and P-VEP P100 peak time was noted. In OAG eyes, PERG P50 to N95 amplitude and VEP P100 implicit time showed the highest sensitivity/specificity for the detection of a visual dysfunction. However, the presence of abnormal PERG and/or VEP responses did not allow a clear-cut separation between ocular hypertension and OAG eyes.20
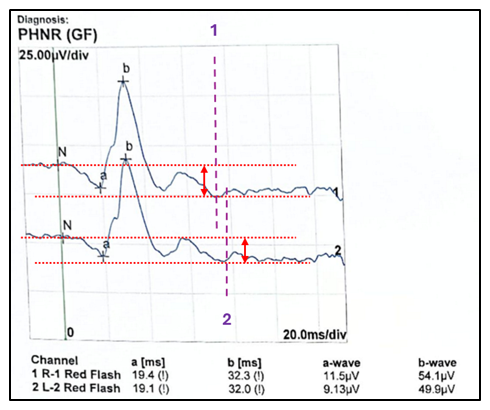
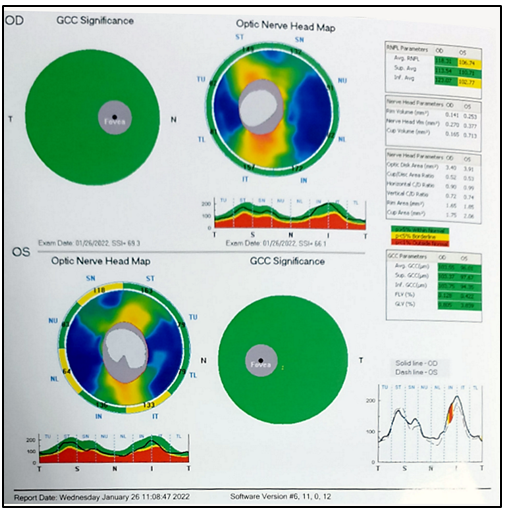
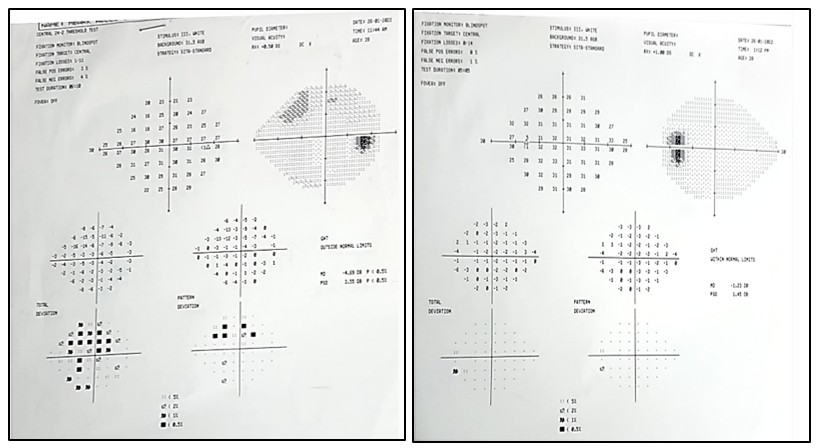
A male patient, 30 years old, coming for check-up. The uncorrected visual acuity LogMAR 0.0, Clinical examination showed that the anterior and posterior segments of both eyes were free apart from mild increase in the CD ratio in the left eye, with the intra-ocular pressure in both eyes being within the average range. On electrophysiological examination, PhNR reduced amplitudes and delayed in both eyes (Figure 2). Optical coherence tomography of the optic nerve head (Figure 3) and perimetry (Figure 4) were requested, both showing changes.

Figure 2 PhNR reduced in both eyes, as we note the delayed response (dotted lines 1 & 2) and a reduced responses (red arrows).

Figure 3 OCT-ONH showing changes in Optic nerve head map with changes in retinal nerve fiber layer parameters (RNFL) and ganglion cell complex (GCC) significance of the left eye.

Figure 4 Perimetry showing visual field changes in the right eye, in the form of mild reduction in the generalized retinal sensitivity and starting a relative upper arcuate scotoma. The patient has been diagnosed with normal tension glaucoma and is awaiting follow-up.
Although the changes in the OCT and perimetry were not bilateral, the PhNR changes were obvious in both eyes, more in the left eye (matching with the structural changes of OCT); thus, highlighting the high sensitivity of the electrophysiological testing to detect cell damage before detecting by other investigative methods.
The role of electrophysiological testing is unique as it can offer an objective, functional and non-invasive assessment of glaucomatous neurodegeneration. Although these techniques cannot replace conventional diagnostic methods, their role in early detection and disease monitoring is increasing, necessitating further research and incorporation into clinical practice.16
None.
The authors declare that there are no conflicts of interest.
None.

©2025 El-Mofty. This is an open access article distributed under the terms of the, which permits unrestricted use, distribution, and build upon your work non-commercially.