eISSN: 2576-4500


Research Article Volume 9 Issue 2
1Departamento de Cartografia– São Paulo State University– Presidente Prudente, Brazil
2Programa de Pós-Graduação em Ciências Cartográficas– São Paulo State University– Presidente Prudente, Brazil
Correspondence: João Francisco Galera Monico, São Paulo State University, Roberto Simonsen, 305-Centro Educacional, 19060-900 Presidente Prudente, São Paulo, Brazil, Tel +551832295511, Fax +551832295500
Received: June 11, 2025 | Published: June 27, 2025
Citation: Silva MS, Monico JFG, Rosa GPS. Climatology of ionospheric scintillation in Brazil between March/2011 and December/2018. Aeron Aero Open Access J. 2025;9(2):123-137. DOI: 10.15406/aaoaj.2025.09.00229
Among the civil applications the critical point is the aeronautical use of satellite-based navigation. No other civilian application has as many standards and safety criteria involved as aviation. The area of civil aviation is one of the main beneficiaries with the use of GPS. The use of GPS for air navigation enables a greater concentration of aircraft in an assured space, since the position of the aircraft is known with certain precision. This information makes it possible to optimize routes, save fuel, and manage air traffic more efficiently. The ionosphere is the main factor that influences the accuracy of the positioning of users who have receivers of only one frequency like civilian aviation case. It is known that the ionosphere affects the GNSS signal in a dispersive and very dynamic way, varying according to solar activity, geographic location, hours of the day or even according to seasonality. In the Brazilian region, the ionosphere has a differently behavior due to the performance of physical phenomena that influence the ionosphere. Among the effects caused on the GNSS signals by the ionosphere, ionospheric scintillation stands out. It is one topic of great interest for investigation because it affects numerous activities that involve positioning, such as precision agriculture, air navigation, among others. Thus, due to its importance and particularity, ionospheric scintillation has been widely studied due to its effects for air navigation and augmentation systems. In this work it is presented an assessment of the statistics of scintillation over different sites in Brazil. Analyzes of variations in the occurrence of ionospheric scintillation are presented. For such analyzes, techniques were used based on the percentage of occurrence of ionospheric scintillation, both in phase and in amplitude, given a certain threshold, as well as statistical techniques. From the data from the GNSS NavAer network, between March/2011 and December/2018 it was obtained that for the amplitude ionospheric scintillation the biggest peaks occurred in the year 2013 and 2014, between 22h and 4h UTC and in the months of October to March, being November the month with the highest occurrence. As for the phase scintillation, the biggest annual peaks were also in 2013 and 2014 in the months of October to March. This research shows which areas are most susceptible to the effects of scintillation and consequently where GNSS-based aviation will be most susceptible to these effects of space weather. Considering the future of aviation in the context of modernized and multi-frequency signals, this work also evaluates different GPS frequencies. The results showed that scintillation performs strongly on GNSS signals and the L5 frequency is more affected by amplitude and phase scintillation than in L1 and L2, although the latter is also seriously affected.
Keywords: climatology, ionospheric scintillation, GNSS signals
The users have become more demanding about products generated from satellite data, thus requiring more accurate products. The main factor affecting the accuracy of GNSS (Global Navigation Satellite System) positioning for single frequency users is the ionosphere. The ionosphere is considered the layer of the atmosphere that is between approximately 50 km and 1,000 km.
A parameter that provides information about the ionosphere is the TEC (Total Electron Content) which consists of the total amount of electrons along the path between the satellite and the receiver. For users who have receivers of two or more frequencies, the TEC can be calculated and/or eliminated from them. However, when the user has only one frequency receivers, some model must be used. However, such modeling is not so trivial, as the TEC varies in space and time, is influenced by the solar ionization flux, geomagnetic activity, sunspot cycle, zenith angle of the Sun, seasons, local time, direction of satellite vector radius and geographic location.1,2
The ionospheric irregularities are due to disturbances in the density of the ionospheric plasma, which originate through Rayleigh-Taylor (R-T) plasma instability processes. When the GNSS signal propagates through an ionospheric region in which the electronic density variation is not regular, ionospheric scintillation occurs. According to,3 ionospheric scintillation can be defined as fluctuations in the amplitude or phase of a radio wave. Ionospheric scintillation effects are most worrisome in the auroral and tropical regions during the nights, close to the spring and fall equinoxes, and the occurrence of scintillations increases during periods of high solar activity or geomagnetic storms.4 In the Brazilian region, scintillations have a higher occurrence from September to March, after sunset until local midnight. This kind of occurrence ends up affecting some activities, among them those that use GNSS positioning in real time, such as precision agriculture and air navigation.
To study, model and mitigate errors arising from the ionosphere and analyze their effects on GNSS positioning in the Brazilian region, the CIGALA (Concept for Ionospheric Scintillation Mitigation for Professional GNSS in Latin America) and CALIBRA (Countering GNSS high Accuracy applications Limitations) projects due to ionospheric disturbances in BRAzil) together with the FAPESP project (Fundação de Amparo à Pesquisa do Estado de São Paulo) called GNSS-SP were instituted. With this, the CIGALA-CALIBRA network was established to monitor ionospheric scintillation in Brazil. Data has been collected since February 2011, when the first two stations were installed at Presidente Prudente-SP (PRU1 and PRU2). Now all these networks have been joined in one - INCT GNSS NavAer Network that has 22 available stations (Figure 1).
The scintillation data used in this investigation was obtained from GNSS scintillation monitors belonging to the NavAer GNSS network, as outlined by.6 The data was collected at a sampling rate of 50 Hz for both amplitude and phase measurements. The receivers used are the PolaRxS model, developed by Septentrio and are capable of simultaneously collecting GPS L1CA, L1P, L2C, L2P, L5; GLONASS L1CA, L2CA; Galileo E1, E5a, E5b, E5AltBoc; COMPASS B1, B2; SBAS L1.7 The network receivers provide the following data:
To explore the network data, a tool called ISMR (Ionosphere Scintillation Monitoring Receiver) Query Tool was developed, where important results are provided for searches that benefit the user interested in ionospheric scintillation.8
In this study, the analysis period spanned from March 1, 2011, to December 31, 2018, encompassing 94 months within solar cycle 24. This period included the ascending phase of the cycle, reaching its maximum in 2014, and subsequently declining to its minimum in 2018. The analysis utilized scintillation indices in both phase and amplitude, specifically referred to as σϕ and S4, as defined respectively by Equations 1 and 2:3
(1)
and
(2)
Where σd is the detrended carrier phase, E[.] the expected value estimated during 60 seconds intervals, I = R2
is the intensity and R is the amplitude of the received signal.
Table 1 presents the coordinates of the stations utilized, along with the corresponding start and end dates of the available data at each station. Following the recommendation of 9 the dataset analyzed was restricted to samples with elevation angles greater than 20 degrees in Brazil. Figure 2 graphically represents the same stations available for analysis, as well as their location in relation to the geomagnetic equator.
|
Station |
Latitude (°) |
Longitude (°) |
Date of start |
Date of end |
|
SLMA |
02°35’36.47" S |
44°12’44.24" W |
12/8/2014 |
31/12/2018 |
|
FRTZ |
03°44’40.39" S |
38°34’39.48" W |
24/10/2013 |
31/12/2018 |
|
UFBA |
12°59’59.37" S |
38°30’38.37" W |
8/11/2013 |
31/12/2018 |
|
SJCU |
23°12’38.12" S |
45°57’23.73" W |
20/05/2011 |
31/12/2018 |
|
MANA |
03°07’11.37" S |
60°00’25.80" W |
17/06/2011 |
28/10/2012 |
|
PALM |
10°11’58.73" S |
48°18’40.67" W |
5/4/2011 |
31/12/2018 |
|
PRU2 |
22°07’19.33" S |
51°24’25.48" W |
1/3/2011 |
31/12/2018 |
|
INCO |
22°19’06.77" S |
46°19’41.20" W |
1/11/2013 |
31/12/2018 |
|
MACA |
22°22’36.53" S |
41°47’28.98" W |
18/05/2011 |
31/12/2018 |
|
POAL |
30°04’26.02" S |
51°07’10.86" W |
4/7/2011 |
31/12/2018 |
|
SJCE |
23°12’27.10" S |
45°51’35.07" W |
12/12/2012 |
31/12/2018 |
Table 1 Station coordinates and operation dates
Furthermore, Table 2 shows the total amount of data available for analysis, which corresponds to the number of rows in the database with a record of at least one observation, the absolute value and in percentage for each specific observation, considering the entire period considered (2011 to 2018), as well as the seasons. The two indices (S4 and σϕ) and the three frequencies used in the analyzes were considered.
|
Station |
S4-L1 |
S4-L2 |
S4-L5 |
σϕ-L1 |
σϕ-L2 |
σϕ-L5 |
|
MACA |
4.00% |
4.00% |
0.00% |
3.73% |
3.73% |
0.00% |
|
MANA |
10.02% |
10.01% |
3.37% |
9.86% |
9.86% |
3.31% |
|
PALM |
61.75% |
61.75% |
37.84% |
59.91% |
59.91% |
37.78% |
|
POAL |
88.82% |
88.85% |
61.76% |
87.22% |
87.27% |
61.68% |
|
PRU2 |
99.07% |
99.03% |
73.89% |
98.95% |
98.91% |
73.73% |
|
SJCU |
91.32% |
91.55% |
52.63% |
90.75% |
91.00% |
52.04% |
|
MAC2 |
25.89% |
25.89% |
0.13% |
19.34% |
19.34% |
0.12% |
|
SJCE |
73.69% |
73.35% |
64.25% |
65.21% |
64.88% |
56.43% |
|
INCO |
99.07% |
96.28% |
57.18% |
62.39% |
62.39% |
58.80% |
|
FRTZ |
59.21% |
59.21% |
55.82% |
59.20% |
59.20% |
55.78% |
|
UFBA |
34.03% |
34.03% |
31.25% |
34.02% |
34.02% |
30.99% |
|
SLMA |
31.48% |
31.48% |
31.17% |
31.45% |
31.45% |
31.14% |
|
MAC3 |
39.12% |
38.02% |
3.52% |
36.44% |
36.31% |
3.50% |
Table 2 Percentage of data available for each station, considering the period from March-2011 to December-2018 as the total
Two methods were used to analise the occurrence of ionospheric scintillation: GBSC (Ground-Based Scintillation Climatology), as described by,10 and CCDF (Complementary Cumulative Distribution Function), following the approach described by.11 The GBSC involves assessing the percentage of occurrence of the phenomenon, either exceeding or falling below a certain threshold.10 The O is computed by Equation 3:
(3)
Where Nthreshold represents the total number of samples above a certain threshold and Ntotal denotes the total number of samples available. According to,11 the CCDF is computed by Equation 4:
(4)
Where NS4 refers to the accumulated number of cases recorded above a certain threshold ς, value of S4, while N represents the total number of samples for the analysed condition.
To classify the severity of the scintillation in terms of amplitude and phase, the classifications outlined by,12,13 as presented in Table 3:
|
Classification |
Amplitude |
Phase |
|
Weak scintillation |
0.2 < S4 ≤ 0.4 |
11.5◦ < σϕ ≤ 17.2◦ |
|
Moderated scintillation |
0.4 < S4 ≤ 0.6 |
17.2◦ < σϕ ≤ 34.4◦ |
|
Strong scintillation |
0.6 < S4 ≤ 1.0 |
σϕ > 34.4◦ |
|
Saturated scintillation |
1.0 < S4 ≤ 1.4 |
|
Table 3 Scintillation severity classification by amplitude and phase
Preliminary analyzes were used to identify and exclude outliers, so that the results were not biased due to problems related to firmware updates or even upgrading the receivers. To find these outliers, the results found from the GBSC method were compared with the literature and with the ISMR Query Tools tool. Figure 3 and Figure 4 show the result of the GBSC method with the thresholds of,12 of the station SJCU and MAC3, respectively, using the L1 frequency for the amplitude scintillation. The months and years are shown on the X axis and the respective percentage of occurrence is shown on the Y axis.
We can observe in the Figure 3 and Figure 4 that the results of percentage of occurrence are at levels completely discrepant from the rest of the period, while the periods without outliers did not reach 20% of occurrence, the periods with outliers, in some cases, reached 100% occurrence of scintillation. For the SJCU station, the first two months of collection (May and June 2011), the months of September and October 2016 and in 2017 the occurrence of scintillation amplitude reached close to 50% and in moderate and strong degrees greater than weak. As for the MAC3 station, there is a lot of saturated scintillation occurring from March 2018, and with an amplitude scintillation occurrence of approximately 100%. In addition to comparing with the behavior in the other months within the analyzed period, we can refer to the literature and observe that the years 2011, 2016 and 2018 are not years of solar maximums, so the occurrence of scintillation should be lower than in the year 2013. And 2014, which are solar maximum years for example. Another method we used to identify outliers was through the ISMR Query Tool. Figure 5 and Figure 6 present the results obtained by using the tool for the SJCU and MAC3 stations.
The Figure 5 presents the data for the SJCU station. We can observe there is a much scintillation at the weak and moderate levels; after there is a lack of data, and later it returns to collect the data, giving indications that there could be a problem in the receiver of this station. For the MAC3 station (Figure 6) it can be observed that the station presents an increase without justification, later there is a failure in data collection and then there is a decline in the values of S4, endorsing the fact that they presented problems that cannot be classified as ionospheric scintillation. For the other stations, the same methodology was applied to remove outliers. Due to the relatively high number of stations to be analyzed in this work and considering the similarities in the results found four stations were selected to have their results presented (Figure 7).
The choice of stations was due to the geographic location and the period of operation, thus allowing for an analysis with a greater coverage of the Brazilian territory, as well as a greater temporal coverage.
From the applied methodology described before, the percentage of occurrence of ionospheric amplitude scintillation was obtained for each station using the three frequencies (L1, L2 and L5). For amplitude scintillation we consider the classification given by.12 Figure 8 shows the results for the amplitude scintillation using L1, where the hours are represented in UTC from 2011 to 2018 on the X axis and the percentage of occurrence of scintillation using the S4 index on the Y axis.
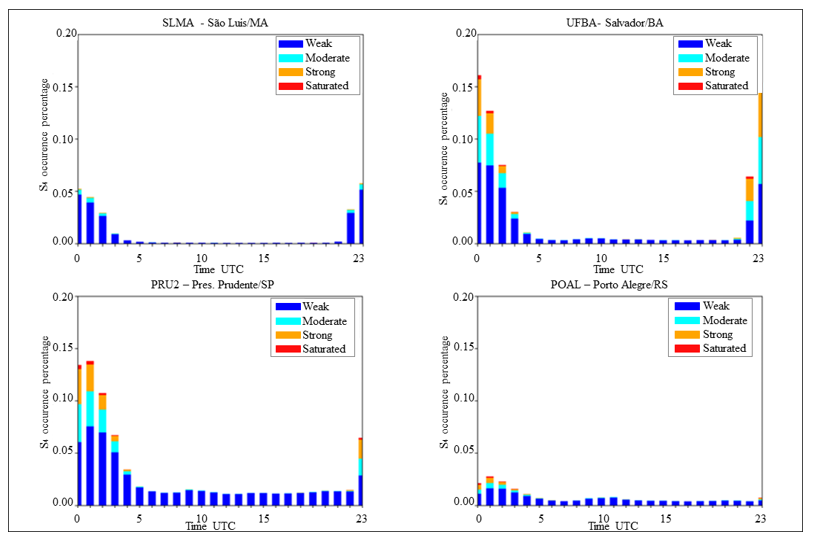
Figure 8 GBSC: S4 Occurrence on the stations SLMA, UFBA, PRU2 and POAL using L1 considering the daily variation.
When analyzing Figure 8, the SLMA station presented a higher occurrence of weak scintillation (from 0.2 to 0.4) between 22:00 and 3:00 UTC, and between 22:00 and 2:00 UTC it can be observed that scintillation up to 0.6 also occurs, classified as moderate by.12
At the station in Salvador/BA (UFBA), it is possible to observe the scintillation occurs with greater emphasis between 22:00 and 2:00, with the highest values obtained between 23:00 and 00:00. In terms of the magnitude of the occurrence, it is noted that saturated scintillation can occur, with S4 reaching 1.4 in this range.
In terms of magnitude, the station located in Presidente Prudente, PRU2, presents a higher occurrence of scintillation. The period that most scintillation occurs is between 10:00 pm and 3:00 am, and 1:00 am is the time that most amplitude scintillation occurs and may even occur in a saturated mode.
At the station located further south of the country, POAL, the occurrence of ionospheric scintillation does not reach 5% and most of its occurrence is weak, its highest occurrence window being from 11pm to 3am, where 1h is the highest value of occurrence, and may even obtain some values of saturated occurrence. The CCDF, which shows the probability that a given value is greater than a threshold, is presented in the Figure 9. On the X axis we have the thresholds that S4 can assume to be higher, while on the Y axis the values of this probability are presented, and the curves are shown every hour. At this moment, the interval between 20:00 and 4:00 was selected, as it presents an increase in the occurrence of scintillation, allowing the analysis of the behavior of S4 in the critical periods.
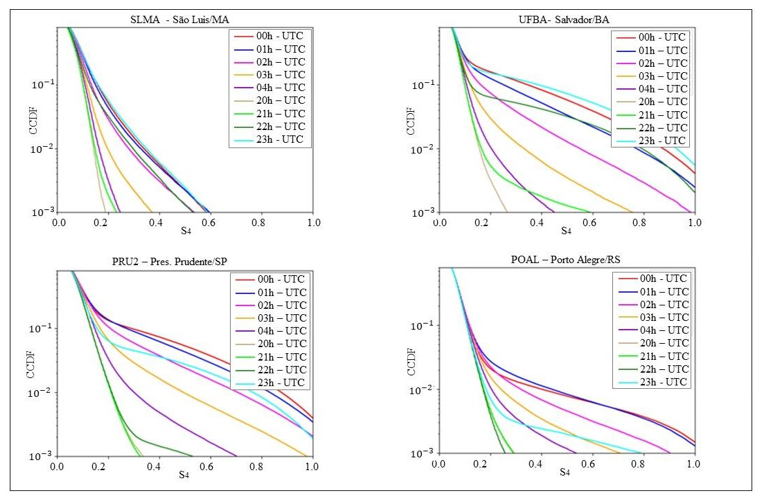
Figure 9 CCDF: S4 Occurrence on the stations SLMA, UFBA, PRU2 and POAL using L1 considering the diary variation.
Figure 9 it is possible to observe that the SLMA station has little probability that the values are greater than 0.6 even when it reaches its highest occurrence at 23:00. Between 11:00 pm and 1:00 am, it can be noted that there is a greater probability that scintillation of greater magnitude occurs than in the rest of the period.
At the UFBA station, it is observed that there is a higher probability of occurrence of scintillation in amplitude at 23:00 UTC and that the scintillation at this time can assume values greater than 1.0. It can still be observed at the UFBA station that the period with the highest probability of occurrence of strong and saturated scintillation is between 10 pm and 2 am.
The PRU2 station has a higher probability of occurrence of values greater than 0.8 at 0h - UTC, different from the UFBA and SLMA stations. It was observed that the station has a probability of strong or saturated scintillation greater than 0.6, between 21:00 and 3:00 UTC, and between 00:00 and 2:00 the probability reaches almost 10%.
For the POAL station, there is approximately 1% occurrence of strong and saturated scintillation between 0:00 and 1:00, thus being the highest occurrence window of scintillation in amplitude. Between 9 pm and 2 am, the values can reach up to 0.9 with a probability of 0.01% and the probability of values greater than 0.5 occurring is less than 1%.
For the analysis of the percentage of occurrence of scintillation in phase, the σϕ index was used, applying the GBSC method. In Figure 10, this percentage of occurrence is presented using the L1 frequency, the X axis being the hours in UTC and the Y axis the percentage of occurrence, classified according to13 where the in-phase scintillation is arranged in weak (blue), moderate (orange) and strong (red). For these studies, the very weak scintillation was disregarded, as it prevented the analysis of the other classifications
From Figure 10 it is possible to observe that the occurrence of in phase scintillation at the SLMA station presented a higher occurrence of weak scintillation between 10:00 pm and 2:00 am, and that between 10:00 pm and 2:00 am UTC it can be observed that moderate and strong scintillation also occurs, which does not happen in the rest of the period.
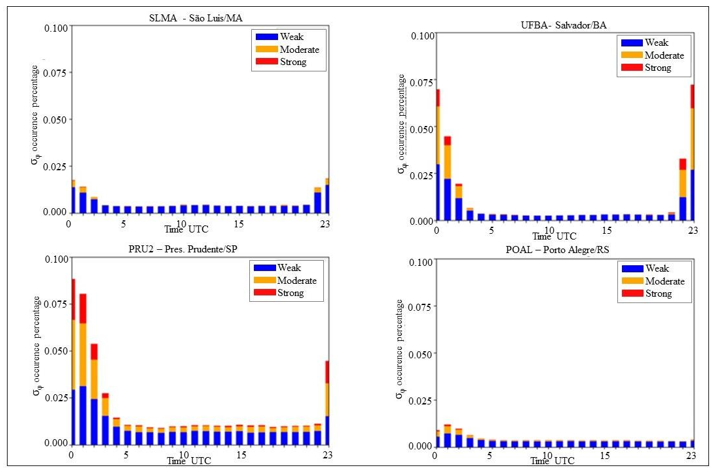
Figure 10 GBSC: σϕ Occurrence on the stations SLMA, UFBA, PRU2 and POAL using L1 considering the diary variation.
At the UFBA station, it is possible to observe that the scintillation occurs with greater emphasis between 10 pm and 3 am, with the highest values obtained until 2 am. Regarding the magnitude of the occurrence, it is noted that the values can reach a strong classification (> 34.4º), with its highest peak between 23:00 and 00:00.
The PRU2 station had the highest occurrence of moderate and strong values for phase scintillation. The period that most scintillation occurs is between 11:00 pm and 3:00 am, and 0:00 am is the time that most scintillation occurs in phase and can be greater than 34.4º.
On the other hand, the POAL station presents the occurrence of ionospheric scintillation in phase with almost linearity, showing a slight increase in scintillation between 00h and 3h. Regarding the magnitude, it can be observed that the highest occurrence is weak and in the window of greater occurrence it can be observed that there is a small percentage of moderate occurrence (between 17.2º and 34.4º) and that the in-phase scintillation peak is located at 1 h.
Presenting the CCDF for the in-phase scintillation in Figure 11, we have on the X axis the thresholds that σϕ, in radians, may be greater and the Y axis brings the probability value, and the curves are shown every hour, between 20:00 and at 4:00 am to analyze the diurnal variation in phase scintillation.
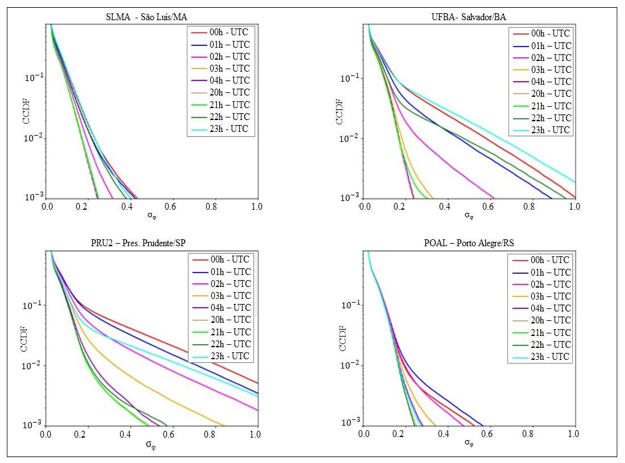
Figure 11 CCDF: σϕ Occurrence on the stations SLMA, UFBA, PRU2 and POAL using L1 considering the diary variation.
Figure 11 shows that the SLMA station has little probability that the values are greater than 0.4 rad (22.9°) even when it reaches its highest occurrence between 11 pm and 1 am. Between 11:00 pm and 1:00 am, it can be noted that there is a greater probability of higher magnitude scintillation than at other times of the day, with 0:00 being the time that has the highest probability of in-phase scintillation assuming values in the moderate range.
It was observed at the UFBA station, that there is a higher probability of occurrence of scintillation in phase at 23h - UTC and that the scintillation at this time can assume values greater than 28° with a probability of 2%. It can still be observed at the UFBA station that the period with the highest probability of occurrence of moderate and strong scintillation is between 10 pm and 2 am.
On the other hand, the PRU2 station showed a higher probability of occurrence of values greater than 0.6 at 0h - UTC, about 2% of occurrence. He observed that the station has a probability of almost 1% of assuming values greater than 0.8 radians (≈ 45◦) at 0h.
For the POAL station, there is 0.01% less occurrence of moderate and strong scintillation between 0:00 and 1:00, which is the highest occurrence window of scintillation. Between 9 pm and 2 am, the values can reach up to 0.57 with a probability of 0.01%, however the probability of values greater than 0.3 occurring is less than 0.04%.
To compare the occurrence in the other frequencies (L5 and L2), the CCDF was calculated for four highlighted stations. Figure 12 shows the comparative results for the scintillation in amplitude between the three frequencies, using all available satellites. On the X axis, the probability that the values are greater than the threshold and the Y axis present the probability that they occur, as well as the curves represent the frequencies L1 (blue), L2 (red) and L5 (magenta).
From the window with the highest occurrence of scintillation, we obtained Figure 12, which shows the probability that the S4 values are greater than a certain threshold. It is possible to observe in the SLMA station that when the values of S4 are smaller, that is, the scintillation in amplitude is weaker, the frequency L5 is less likely to be influenced than the other frequencies. However, when we analyze S4 from 0.17, we can see that L1 has less influence of moderate, strong, and saturated scintillation than L5 and L2.
At the UFBA station, we can observe that again L1 has a lower influence of scintillation greater than moderate and that L5 has a greater influence in amplitude scintillation, when S4 values are greater than 0.30. Analyzing the probability that S4 assumes a value greater than 0.80, we have that for L1 it is approximately 0.7%, while for L2 it is 1.07% and for L5 we have 1.10%.
At the PRU2 station, we can observe that the amplitude scintillation has a greater influence on the L2 frequency, regardless of the S4 value. On the other hand, L1 and L5 present a behavior like that observed in the other stations: when S4 assumes lower values, L5 has a lower probability of influence, whereas when scintillation occurs moderate, strong, or saturated, L1 has a lower probability. Still, when the scintillation has a value greater than 0.80, it is possible to notice that the probability of occurrence is 0.06% in L1, in L5 it is approximately 1% and in L2 we have a little more than 1% probability.
At the POAL station, the effects are milder, values of S4 greater than 0.8 do not exceed 0.03% of probability of occurrence, even when considering L5, the frequency that is most influenced by the scintillation in amplitude. It is also observed that the probability of weak scintillation is lower in L5 than in the other frequencies and this probability increases as the value of S4 increases, reaching almost 20% higher than in L1.
For the analysis of scintillation in phase, the CCDF calculated at the three frequencies was used (Figure 13) in a similar way to that performed for amplitude scintillation. Again, we have the X axis the probability that the values are greater than the threshold and the Y axis present the probability that they will occur, in addition we have the curves representing the frequencies L1 (blue), L2 (red) and L5 (magenta).
Figure 13 presents the probability that the values of σϕ are greater than a certain threshold. In the SLMA station, it is possible to notice that, regardless of the values of σϕ, L5 always has less influence than the others. It is also observed that up to approximately 0.2 rad (11.5°) the L1 and L2 frequencies present values very close to the probability of occurrence.
At the UFBA station, we can observe that again L1 has a lower influence of cintillation greater than moderate and that L5 has a greater influence of scintillation in phase, when the values of σϕ are greater than 0.80 rad (45°). We also have that for L1 the probability of occurrence is approximately 0.015%, and for the other frequencies the values are close.
At the PRU2 station, it can be noted that the in-phase scintillation at frequencies L1 and L5 presents a behaviour like that observed in the other stations: when σϕ assumes smaller values L5 is less likely to be influenced, whereas when the scintillation occurs moderate, strong we have that L1 has a lower probability. It was also observed that The scintillation has a value greater than 0.80, the probability of occurrence is 0.04% in L1 and in L2 and L5 it is approximately 0.05%.
In the POAL station the effects are milder. Values of σϕ greater than 0.3 rad (17.8°) do not exceed 0.015% probability of occurrence, even when considering L1, the frequency that has the greatest influence of phase scintillation for this station. It is also observed that the probability of weak scintillation is lower at L5 than at the other frequencies and this probability increases as the value of σϕ increases, and from 0.3 onwards we have that L2 is the one with the lowest probability of suffering ionospheric scintillation influences.14 Presents an analysis of the occurrence of ionospheric scintillation and shows that, compared to the other frequencies, L5 was more susceptible to scintillation influence, both in phase and amplitude, while L1 showed less influence. However, in the experiment by14 the proportion of this influence is greater, since the studies presented in the work are for periods of considerable occurrence of ionospheric scintillation.
From the available data, it was also possible to observe the influence of seasonality on ionospheric scintillation. Thus, the percentage of occurrence of ionospheric scintillation in amplitude and in phase was obtained for each station using the available frequencies. In the analysis of scintillation amplitude used the same thresholds for classification given by.12 Figure 14 presents the results for the scintillation in amplitude using L1, with the months represented by the X axis and the Y axis showing the percentage of occurrence of scintillation, using the S4 index.
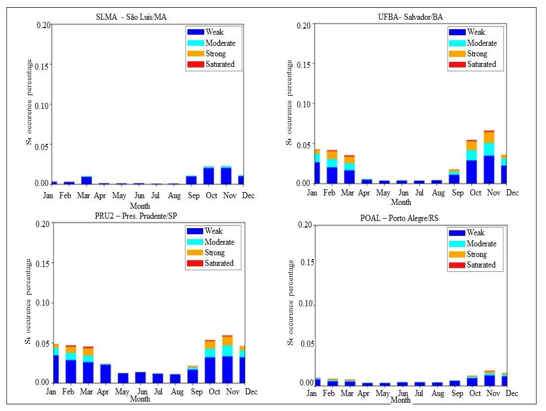
Figure 14 GBSC: S4 Occurrence on the stations SLMA, UFBA, PRU2 and POAL using L1 considering the month variation.
From Figure 14, it is possible to observe that the station located further north of the country (SLMA) presented the highest occurrence of weak scintillation in the period from September to March, with the months of October and November with the most occurrences of this magnitude as well as the highest occurrence. Of moderate scintillation, reaching close to 2% of occurrence. From April to August, it can be noted that the occurrence of scintillation is very low, with approximately 1% of occurrence.
In the UFBA station, the months from April to August do not show a significant amount of scintillation, and that from September to March we have a greater occurrence of scintillation in amplitude. The month of November, differently from what was found in the SLMA station, presented the highest occurrence of scintillation, approximately 8%. It was also observed that the month of March, despite not showing much occurrence of weak scintillation, presented a higher occurrence of saturated scintillation.
In the PRU2 station, we again have the month of November with the highest occurrence of ionospheric scintillation, approximately 6%, followed by the months of October with 5% and March with a value close to 4%. Once again, it is observed that, although in November there is more scintillation, in March the occurrence is stronger. The months of April and September have more scintillation when compared to the SLMA and UFBA stations, but they are milder months. From May to August, scintillation has little occurrence. In POAL, the occurrence of ionospheric scintillation does not exceed 2% and the highest occurrence is weak, with its highest occurrence window between October and March. For this season, November, there is more scintillation, but compared to PRU2, for example, the occurrence is much lower.
For a better understanding, the CCDF was calculated, which shows the probability that a certain value is greater than a threshold (Figure 15). On the X axis we have the thresholds that S4 can assume to be higher, while on the Y axis the values of this probability are presented and the curves are presented by the seasons, allowing the analysis of the seasonality of each season.
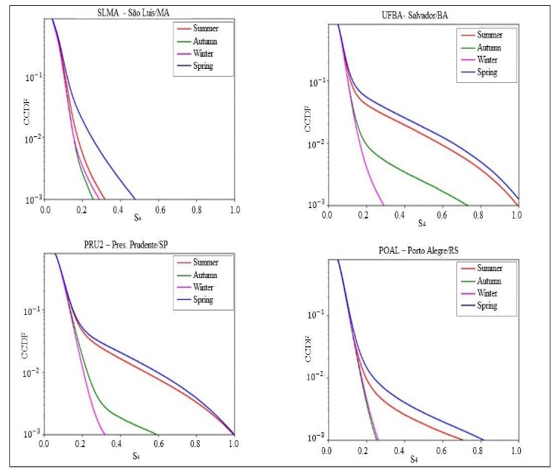
Figure 15 CCDF: S4 Occurrence on the stations SLMA, UFBA, PRU2 and POAL using L1 considering the season.
From Figure 15, it is possible to observe that the SLMA season has little probability that the values are greater than 0.5 even when it reaches its highest occurrence during the spring. In autumn and winter, it can be noted that the occurrence of scintillation is much lower, not reaching 0.3. In summer, the probability of occurrence value reaches 0.3, even with a 0.1% probability of occurrence.
In the UFBA station, it is also observed that there is a higher probability of occurrence of scintillation in amplitude in the spring but compared to SLMA the probability of occurrence for strong and saturated values is much higher. In spring we have 1% of occurrence above 0.6 and for summer we have almost the same probability of occurrence. The PRU2 station has a higher probability of occurrence in spring and summer, in autumn the values can reach close to 0.60 and in winter they do not exceed 0.30.
For the POAL season, the values during spring can reach 0.80 with a probability of 0.80, but when analyzing autumn and winter, we can observe that they do not exceed 0.3%.
Figure 16 shows this percentage of occurrence using the L1 frequency, with the X axis being the months and variation the Y axis the percentage of occurrence, classified according to.13
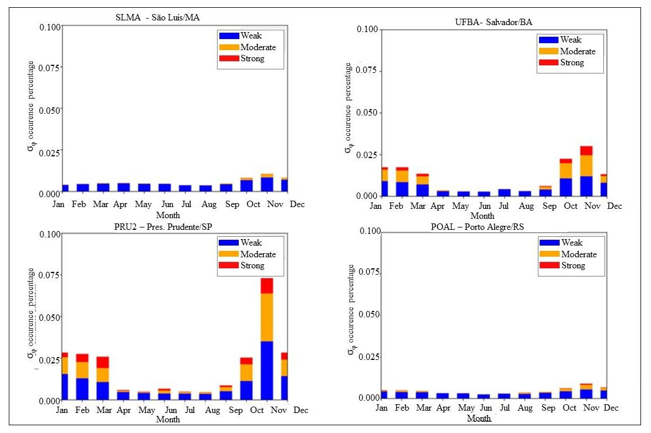
Figure 16 GBSC: σϕ Occurrence on the stations SLMA, UFBA, PRU2 and POAL using L1 considering the month variation.
In Figure 16, according to the thresholds defined by,13 it is possible to notice that for the SLMA station the phase scintillation values can reach 30%, most of which are weak scintillation. It is still observed that the months of October and November have the highest scintillation, followed by March. In the other months, the values of occurrence of scintillation in phase are low.
At the UFBA station, it can be noted that there is an occurrence of moderate and strong scintillation from December to March, with the highest occurrence in November and the month with the lowest occurrence of phase scintillation in July.
The PRU2 station, on the other hand, presents approximately 45% of occurrence of scintillation in phase, being around 3.5% of this moderate or strong occurrence in the month of November. It is also possible to observe that from April to September the occurrence is at the weak level, and from October to March the region also presents occurrence at moderate and strong levels. The POAL station is also dominated by weak scintillation. The month of November has 0.6% of moderate occurrence, which is the month with the highest occurrence of phase scintillation for the POAL station.
Calculating the CCDF for the phase scintillation in Figure 17, we have on the X axis the thresholds that σϕ, in radians, may be greater and the Y axis brings the probability value, and the seasonality is represented by the curves. It was observed in the SLMA station, that there is a higher probability of occurrence of phase scintillation in the spring and that the scintillation at this time can assume values greater than 17.8° with a probability of approximately 0.2%. For summer, autumn and winter, the probability of occurrence was not higher than 17.8.
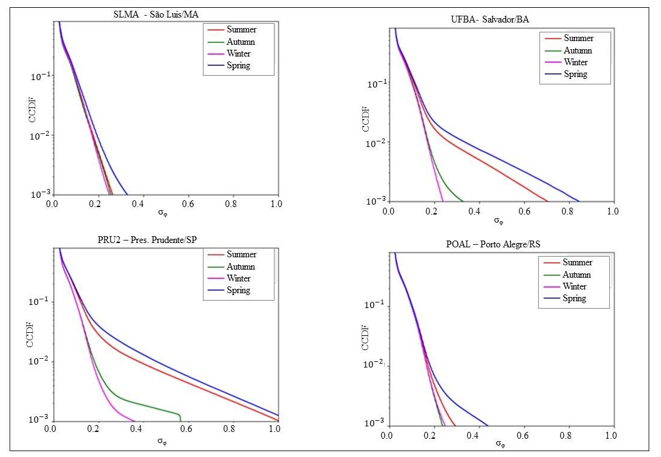
Figure 17 CCDF: σϕ Occurrence on the stations SLMA, UFBA, PRU2 and POAL using L1 considering the season variation.
In the UFBA station, there is a higher probability of occurrence of scintillation in the spring phase, followed by summer, autumn and winter. In summer, the probability that the scintillation reaches 34.4° is approximately 0.2%, while in spring it is 0.4%. In autumn and winter the values do not reach 23°.
PRU2 has a higher occurrence of scintillation in spring, with a probability of almost 0.3% being greater than 46°. In summer, the probability of occurrence values is very similar. In spring and autumn, the probability of occurrence is much lower, and in spring the values do not reach 23°. For the POAL season, except for spring, scintillation occurs only weakly. In spring, we have that the values can reach 23° with a probability of approximately 0.15%.
According to 15 who makes a climatological analysis for the station located in Cachoeira Paulista, shows that from September to March, the scintillation in amplitude has a greater influence on GNSS signals, while June has a lesser influence.
From the available data, it was also possible to observe the variation according to the solar cycle. Thus, the percentage of occurrence of ionospheric amplitude and phase scintillation was obtained for each station using the available frequencies. In the analysis of scintillation and amplitude use the same thresholds for classification given by.12 Figure 18 presents the results for the amplitude scintillation using L1, with the years represented by the X axis and on the Y axis the average of the percentage of scintillation occurrence during the analyzed period is presented, using the S4 index.
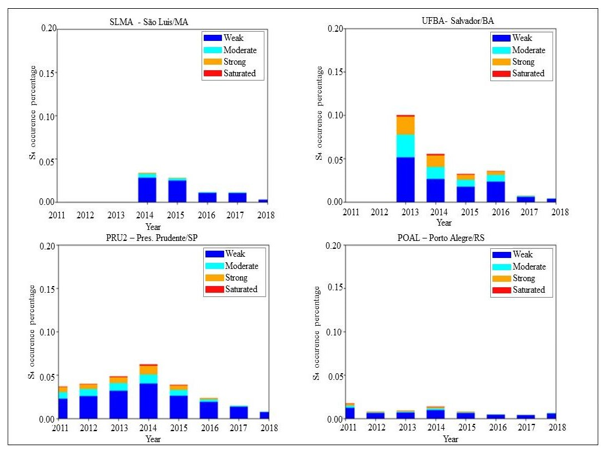
Figure 18 GBSC: S4 Occurrence on the stations SLMA, UFBA, PRU2 and POAL using L1 considering the solar cycle variation.
From Figure 18, the SLMA station had a higher occurrence of S4 in 2014 and a lower occurrence in 2018. In 2018, it is possible to observe that the occurrence is not moderate and strong. In 2014 it is possible to notice the occurrence of scintillation above the moderate level.
The UFBA station had its highest peak in 2013, but due to its short collection period it should not be considered. Thus, the year 2014 had the highest occurrence, followed by the years 2015, 2016, 2017, and 2018 was the year with the lowest occurrence of amplitude scintillation
At the PRU2 station, unlike what happened at the UFBA station, the percentage of occurrence is higher in the year 2014, with scintillation from weak to saturated, reaching approximately 7% of scintillation occurrence. For the POAL station, there was an increase in the percentage of occurrence until 2014, where there was a greater occurrence of scintillation in amplitude and there is a decrease in the percentage of occurrence until the year 2018. In Figure 19, this probability of occurrence is presented using the frequency L1, with the X axis being the value of S4 and the Y axis the probability of occurrence.
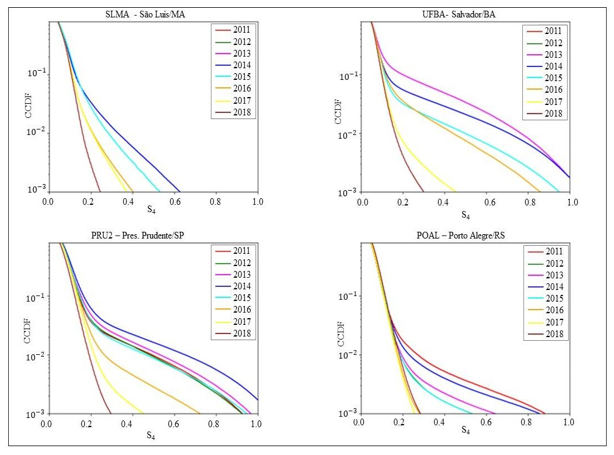
Figure 19 CCDF: S4 Occurrence on the stations SLMA, UFBA, PRU2 and POAL using L1 considering the solar cycle variation.
In Figure 19, it is observed that the SLMA station presented the scintillation values in phase can reach values greater than 0.6 even with a low probability in the year 2014. As in the previous graphs, it can be observed that the year 2018 has a lower probability of occurrence of scintillation.
In the UFBA station, we have that the year 2013 presents approximately 12% of probability that the amplitude scintillation is greater than 0.6, which should not be considered due to the collection period, while the year 2014 presents 11%, being these are the years with the highest probability of above-moderate scintillation. The year 2018 is no more than 0.3, even with a probability of 0.1%, being the year with the lowest probability of strong scintillation.
PRU2, in turn, has a higher probability of strong scintillation occurring in 2014, reaching a probability of approximately 10% that this value is greater than 0.8. The year with the lowest probability of occurrence is 2018 again, and this does not exceed 3%.
The POAL station had the highest occurrence in 2014, with a probability of 0.15% of occurrence greater than
0.8 in 2016 to 2018, the values do not exceed 0.3. Figure 20 shows the percentage of occurrence values for σϕ
from 2011 to 2018.
Figure 20 shows that in-phase scintillation for the SLMA station has a higher occurrence in the year 2014 with almost 2.5% of occurrence, while the year with the lowest occurrence of in-phase scintillation is the year 2018, with almost 1, 5% occurrence.
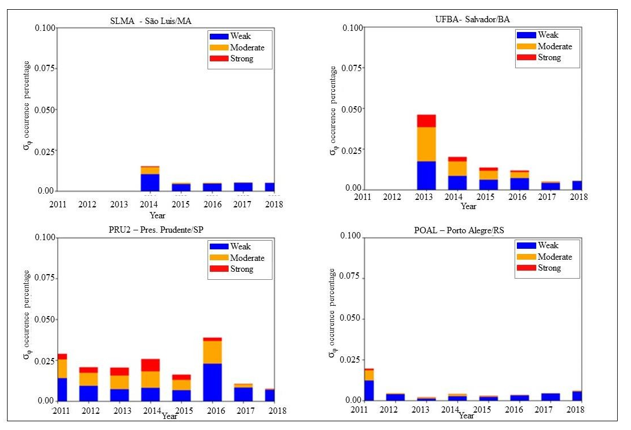
Figure 20 GBSC: σϕ Occurrence on the stations SLMA, UFBA, PRU2 and POAL using L1 considering the solar cycle variation.
In the UFBA station it is possible to observe the year 2013 presented a higher occurrence of scintillation presenting moderate and strong scintillation significantly, due to its short collection period. While in 2018 the occurrence was only weak, that is, less than 34°.
In the PRU2 station, it is noted that in 2014 we had a higher occurrence of in-phase scintillation, reaching almost 2.5%, with weak, moderate, and strong scintillation. It is also possible to observe that in 2018 is the period that occurs less scintillation and that occurs with milder values.
The POAL station has mostly weak scintillation. In 2014 we have the year with the highest occurrence of ionospheric scintillation and in 2018 we have the year with the lowest occurrence. To verify the probability that the phase scintillation was greater than a certain threshold, the CCDF was calculated (Figure 21) with the curves representing the years, and on the X axis the thresholds that σϕ, in radians, could be greater and the Y axis brings the probability value.
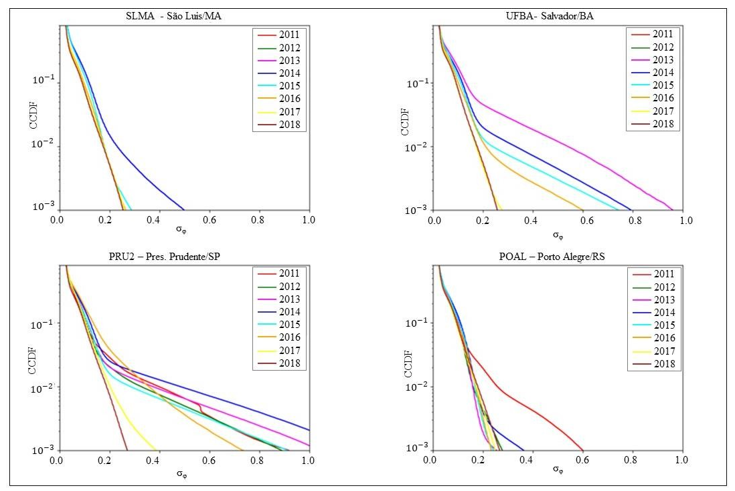
Figure 21 CCDF: σϕ Occurrence on the stations SLMA, UFBA, PRU2 and POAL using L1 considering the solar cycle variation.
Figure 21 shows in 2014 we have the highest probability of the occurrence of phase scintillation and its value can reach approximately 28° (at 0.5 rad) with a probability of 0.10%, while in 2018 with the same probability it can reach a value of 17.7° (0.3 rad).
In the UFBA station it is possible to observe that the year 2013 presented more than 10% probability that the phase scintillation is greater than approximately 11° (0.2 rad), due to the period in which this station was operating, while in 2018 this probability was less than 1%. It is also observed that in the year 2013 there is a 1% probability that the in-phase scintillation will reach values greater than 34.4° (0.6 rad).
For station PRU2, we have again that 2018 is the year with the lowest occurrence of in-phase scintillation, with a 1% probability that the value of σϕ is greater than 11° (0.2 rad). Unlike the UFBA station, we have that the year 2014 has a higher probability of occurrence of moderate and strong scintillation. In the POAL station, in all the years analyzed, it presented a low probability of occurrence of scintillation in phase, being in 2014 the year with the highest probability of occurrence of values close to 21.91° (0.4 rad). Relating to scintillation, both in amplitude and in phase, we can see that solar activity is correlated with the occurrence of scintillation in GNSS signals.
From the available data from the stations, it was also possible to observe the variation according to latitude. Thus, the percentage of occurrence of ionospheric scintillation in amplitude and in phase was obtained for each station using the available frequencies. In the analysis of scintillation and amplitude use the same thresholds for classification given by.12 Figure 22 presents the results for the amplitude scintillation using L1, with the stations represented by the X axis and on the Y axis the average of the percentage of occurrence of scintillation during the analyzed period is presented, using the S4 index and σϕ index to measure the phase scintillation.
In Figure 22 it is possible to observe that the POAL station has a lower occurrence of ionospheric scintillation, around 1%, then we have the SLMA station with 1.2%, the UFBA station with 3.1% and the PRU2 station with 3.8% occurrence of ionospheric scintillation. It is also observed that the SLMA station, despite not being the station with the lowest occurrence of scintillation, is the station with the lowest occurrence of moderate, strong, and saturated scintillation. The POAL station, on the other hand, has the lowest occurrence of scintillation in amplitude, but has more moderate, strong, and saturated scintillation than the SLMA station.
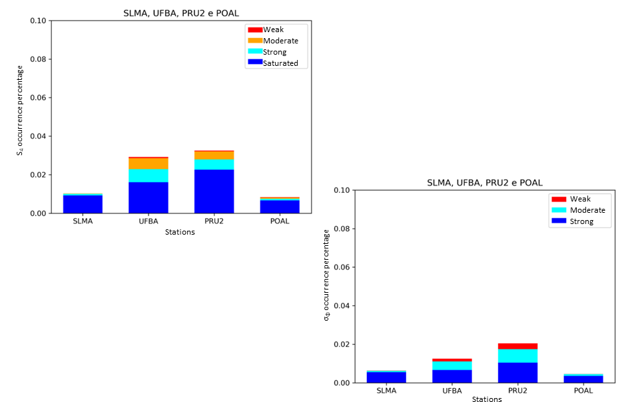
Figure 22 GBSC: σϕ and S4 occurrence on the stations SLMA, UFBA, PRU2 and POAL using L1 considering the latitude variation.
We also can observe that that the POAL station, again, presents a lower occurrence of scintillation, this time in phase, less than 0.7% and soon after we have the SLMA station with approximately 0.8%, the UFBA station with 1, 3% and the PRU2 station with approximately 2.0% phase scintillation occurrence. Another factor that is observed is that the phase scintillation, despite the occurrence being smaller in the POAL station, its magnitude is greater than in the SLMA station.
From the analyzes carried out, it was possible to observe that ionospheric scintillation is intense in most of the Brazilian region, thus affecting activities that use GNSS positioning, such as agriculture, maritime navigation, air navigation, among other applications.
It was observed that the variation of amplitude and phase scintillation is highly correlated with the flux of solar activity, that is, the greater the solar flux, the greater the probability of occurrence of ionospheric scintillation. It was also possible to observe that the ionospheric irregularities also vary according to the increase in solar flux. Thus, within the period studied, the years 2013 and 2014 had a higher occurrence of amplitude and phase scintillation, while 2018 had a lower occurrence of ionospheric scintillation.
From April to September, scintillation was virtually absent, corresponding to the lack of ionospheric bubbles during this period. Regarding seasonal variation, it was observed that from April to August, there was virtually no scintillation classified as moderate, strong, or saturated. A slight increase occurred in September, and from October to March, the occurrence of ionospheric scintillation was notably higher. November, in particular, showed a higher frequency of scintillation, which aligns with the period of increased ionospheric bubble activity. Additionally, a peak in seasonal variation was observed in March, corresponding to the period of maximum ionospheric bubble occurrence. From April to September, scintillation was nearly absent, correlated with the presence of ionospheric bubbles. Concerning phase scintillation, the same pattern was observed as with amplitude scintillation: higher occurrence from October to March, a slight increase in September, and lower activity from April to August. This behavior reflects the seasonal influence on ionospheric irregularities affecting both amplitude and phase scintillation.
Regarding diurnal variation, it was observed that fluctuations in scintillation amplitude closely mirror variations in phase scintillation. The peaks in amplitude scintillation occurred predominantly between 22:00 and 04:00 UTC, and similar peaks in phase scintillation were noted within the same time frame, differing only in magnitude. Additionally, stations located further east experienced an increase in scintillation occurrence earlier than those situated further west. The latter exhibited a delayed increase, aligning with the sunset terminator, which moves from east to west. This pattern is consistent with the generation of ionospheric irregularities, as ionospheric bubbles form and subsequently drift eastward from west to east, following the magnetic equator.
Regarding the variation in scintillation occurrence according to station latitude, higher S4 index values were observed at the UFBA and PRU2 stations, while the SLMA and POAL stations exhibited lower occurrence percentages. This is attributed to the position of these stations relative to the ionospheric anomaly: UFBA and PRU2 are situated within the EIA crest, whereas SLMA is located on its edge and POAL outside the anomaly region. In terms of in-phase scintillation, a similar pattern emerged, with UFBA and PRU2 showing higher occurrence rates and SLMA and POAL displaying lower rates, which can also be linked to their relative positions concerning the EIA.
It was also observed that for lower S4 values, the L5 frequency has a reduced probability of scintillation occurrence compared to L2 and L1. Conversely, as scintillation intensifies—indicated by increases in S4 and σφ—the likelihood of L5 experiencing scintillation surpasses that of the other frequencies. Therefore, we can conclude that the effects of ionospheric irregularities on GNSS signals vary among frequencies, with L5 being more susceptible to moderate or strong ionospheric scintillation.
This paper provides a synthesis of the thesis presented by,16 from which the following conclusions are drawn:
It is also important to note that advanced machine learning techniques are currently being developed to enhance data processing accuracy and validate raw ionospheric scintillation data as part of future improvements.
We acknowledge the National Institute of Science and Technology for GNSS in Support of Air Navigation (INCT GNSS-NavAer), funded by CNPq (465648/2014-2), FAPESP (2017/50115-0), and CAPES (88887.137186/2017-00. Dr Monico also acknowledge CNPq Grant 304773/2021-2.
Author’s contribution
Mariana Santos Silva– Unesp– Universidade Estadual Paulista Júlio de Mesquita Filho wrote and organized the f igure and data selection, as well as the analysis.
João Francisco Galera Monico– Unesp– Universidade Estadual Paulista Júlio de Mesquita Filho contributed the ideas for the paper and conducted most of the revisions.
Guilherme Poleszuk dos Santos Rosa– Unesp– Universidade Estadual Paulista Júlio de Mesquita Filho reorga nized the paper and provided the final revision.
The author declares that there are no conflicts of interest.
None.

©2025 Silva, et al. This is an open access article distributed under the terms of the, which permits unrestricted use, distribution, and build upon your work non-commercially.